Table of Contents
Simple Business Dashboard
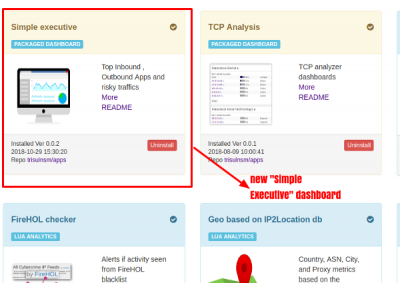
Trisul Network Analytics throws up TONS of metrics. Right out of the box you get about 200+ metrics across 40 counter groups. Sometimes presenting this information can be a challenge. The default install of Trisul puts about 10 dashboards we have selected to put up on the menu.
The new Simple Business dashboard gives many customers a different starting point into Trisul, from where you can drill down into other places.
Installing Simple Dashboard
Using Simple Dashboard
Once you install the APP two dashboards are installed.
- A Live Dashboard for showing current data. Accessible from Dashboards > Show All
- A Retro Dashboard for analyzing historic data. Accessible from Retro > Retro Tools > Retro Dashboards
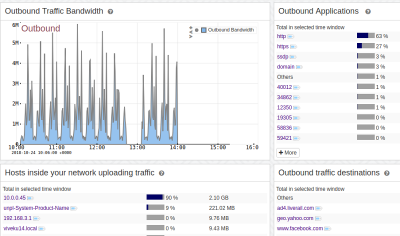
The following data is displayed in the Simple Business dashboard. All items can be drilldown by clicking on the blue button next to the item.
| data displayed | number of charts | what is shown |
|---|---|---|
| Outbound traffic breakup | 4 modules | Upload traffic bandwidth, Outbound applications, Top Hosts inside your network uploading data, Top hosts outside your network where data is being uploaded |
| Inbound traffic breakup | 4 modules | Download traffic bandwidth, download applications, Top downloading hosts inside your network, Top downloading hosts from outside |
| Totals | 4 modules. Total traffic, apps, top internal and external hosts | |
| Applications | 1 module | Internet applications breakup based on “Base domains” feature. Shows you how much YouTube, Facebook, Twitter, Netflix, and others independent of IPs |
| Top Risks | 1 module | Top major alerts seen recently |
You can remove or add any other modules you want to this dashboard !!

