Table of Contents
How to analyze large PCAP files using TrisulNSM Docker
While live traffic capture is the predominant mode of Network Security Monitoring, it is also crucial to be able to load packet capture (PCAP) dumps. A couple of key requirements for the PCAP import process
- The results should be as if the analysis was done as a live traffic capture
- Timestamps must reflect the PCAP time and not the import time
- Clock - The import process should be clocked off the packet timestamps. This means that if a PCAP file contained 10 hours of traffic, the import process should not require 10 hours. This means a tcpreplay based rig , even if the timestamp issues are solved, will not be optimal for large timeframes.
- Encrichment and intel feeds such as Geo-IP, Blacklists, Domain Databases, may reflect current time, rather than PCAP time. This is for practical reasons.
- Search vs Streaming import PCAP is a bit harder for streaming pipelines like Trisul compared to Elastic Search backends. This is due to the possibility of the streaming window closing before all the events come in.
Tools
Here are some of the tools in the NSM ecosystem that generate various types of data that need to be orchestrated.
- Argus or SiLK : Try to index them from a flow perspective. Argus or SiLK can do this.
- Bro : turn the PCAPs into bro logs, which record flows, dns, files, http request, and a number of other things
- Suricata / Snort : Run an IDS ruleset over the PCAPs.
- Security Onion : The NSM distro that packages everything you need. The latest version of Security Onion includes a script to automate this process.The backend storage and reporting is now Elastic Search.
- Moloch : Index raw packets for fast recall. Also stores into Elastic Search.
- NTOP : Traffic monitoring
- Wireshark/NetworkMiner : The ultimate destination for bit level protocol analysis.
- TrisulNSM : Traffic metrics at its core, but also does flows, packet indexiing, metadata extraction, and other NSM functions. Trisul uses Stream Processing instead of Search as its backend. The free license allows you to import any number of PCAPs as long each PCAP isnt longer than 3 days.
This article explains how the new Trisul Docker Image can help you analyze PCAPs offline.
Instructions : How to run the Docker image over PCAPs
Put the PCAP dump into the shared docker volume so that the container can read the PCAP.
mkdir /opt/trisulroot
cp myhugeCapture.pcap /opt/trisulroot
Run the trisul6 docker image on the PCAP
docker run --privileged=true \
   --name trisul1a \
    --net=host  \
      -v /opt/trisulroot:/trisulroot \
       -d trisulnsm/trisul6 \
        --fine-resolution \
         --pcap myhugeCapture.pcap
Now wait for the import to complete. The time taken to complete the import is not proportional to the size of the PCAP, but to the duration of the PCAP. If your PCAP has two days traffic, then expect the import process to take up to 10-20 minutes.
To check on progress , tail the log and wait for confirmation message!
docker logs -f trisul1a
Of course you can also do the normal docker commands logging into the container docker exec -lt trisul1a /bin/bash Then use top or check the logs located under /usr/local/var/log/trisul-probe/
Single pass only
If you are not interested in IDS alerts that Suricata provides then you can do a single pass analysis with Trisul only. Use the –no-ids switch as shown below
docker run  --name trisul1a --net=host \
   -v /opt/trisulroot:/trisulroot \
     -d trisulnsm/trisul6 \
        --pcap BSidesDE2017_PvJCTF.pcap \
          --no-ids
Analysis
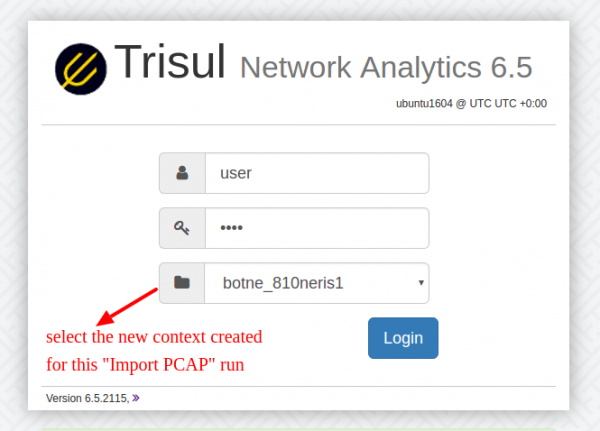
Once loaded you need to point your browser to ip:3000 and select the newly created context for the run.
After you login here are some suggested steps
- Go to Retro Counters to get details metrics and toppers across 40+ counter groups
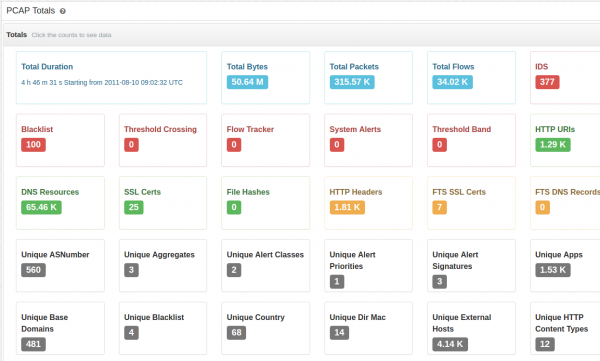
- Use the “PCAP Totals” Trisul APP to get the drilldown dashboard shown below
- Tools > Explore to query flows.
Processing Compressed PCAP files
Trisul can handle compressed PCAP files (gz, bz2) , a large number of PCAPs in a directory, or even a directory tree. Trisul will automatically process the files in order of the timestamp in the first packet in each file. However, Suricata isnt able to handle that. If you need the full IDS alerts + Traffic analytics then you need to process a single uncompressed file at at time. You can use mergecap to combine them outside of Trisul.
Multiple imports
Once the import has been completed, the results are stored in a separate context. While logging in you select context you want to see. Login from http://ip-address:3000.
After completion you need to remove the instance and start a new one.
docker stop trisul1a
docker rm trisul1a
Then you can import any number of files one after the other, they will be created in a separate context each time, so you can keep the data sets separate.
Free image
The docker image includes a Free License of Trisul that allows PCAPs of a maximum of 3 days. This should suffice for most people.
How it works : Two pass analysis
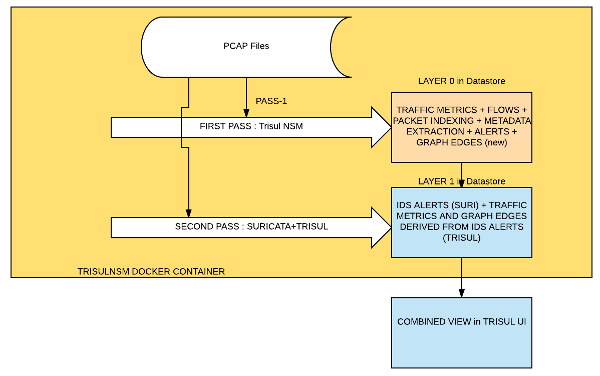
When you specify –pcap the Docker Image automatically runs two passes over the PCAP file.
- Pass 1 : Using Trisul, we collect deep traffic metrics, reconstruct and analyze flows, extract metadata, index and store packets. This goes to Layer 0 on the Trisul backend database.
- Pass 2 : Using Suricata + Trisul, we generate IDS alerts and convert those into metrics and graphs. Examples are vertices from a specific SIGID or Host. Top-k for hosts that are in attacker role, etc. This goes to Layer 1
The final result is a merger of Layer 0 + Layer 1. You can pivot from alerts to flows to TLS certificates down to packets.


