Table of Contents
Troubleshooting Netflow
This article explains how you can troubleshoot the following problem.
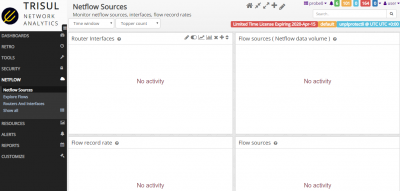
No data on the dashboard after enabling Netflow in Trisul Network Analytics.
Precondition
This configuration must have been already done in your network.
- Trisul Network Analytics installed in Netflow mode
- Atleast one device configured to send Netflow to Trisul IP address
- Wait for atleast 5 minutes after starting Trisul
If there is still no data in Trisul, please run through the following checklist.
Checklist
1. Check if netflow packets are being received
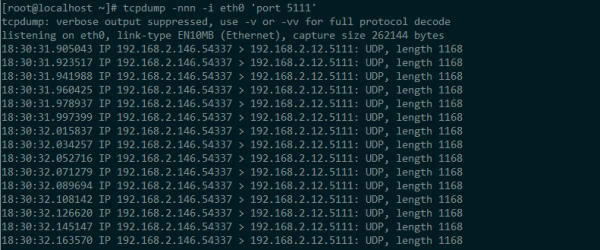
Check whether Netflow records are indeed coming in on the Trisul interface using tcpdump.
Say you have configured the following.
- interface name : eth0
- port number on which netflow is expected : UDP 2055
run the following command
tcpdump -nnn -i eth0 'port 2055'
Do you see netflow packets on the screen ?
Yes. Move to next
No. Check the following.
- Check if the port number is correct.
- Check the Firewall.
- restart Trisul.
2. Check if the Nodes are turned up
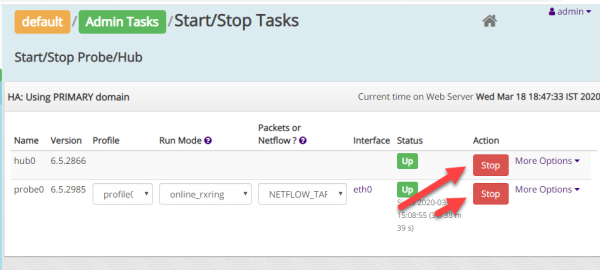
Check if the nodes are up by selecting Context: Default —> Start/Stop Tasks
Are the nodes turned on? Check if all the probes and hubs are in the Started position.
Yes. Move to next.
No. Start it by clicking on the Start button or run the following command from the CLI
trisulctl_probe start context <context name>
3. Check if the Network Interface is correct.
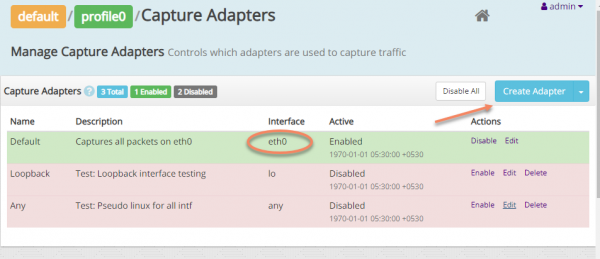
You can view the network interface by using Admin>profile0>Netflow Wizard>Select Network Interface.
Say you have a network interface eth0.
Is it Enabled?
Yes. Move to next.
No. Enable the interface eth0. If any other interface.Click “Create Adapters” option and add the new interface.
4. Check if the NETFLOW_TAP mode is enabled
You can switch between Packet or Netflow mode by using Context: Default —> Start/Stop Tasks.
Is NETFLOW_TAP mode enabled?
Yes. Move to next
No. Change it from TAP mode to NETFLOW_TAP mode.
5. Check if the Netflow ports are interpreted correctly
By default,traffic on UDP ports 2055,2056,2057,9500,9993 is interpreted as Netflow.
Is the port added to netflow?
Yes. Move to next step.
No. Add the specific port number to Netflow using Context: default → profile0 → Netflow Wizard.
6. Check whether templates are visible
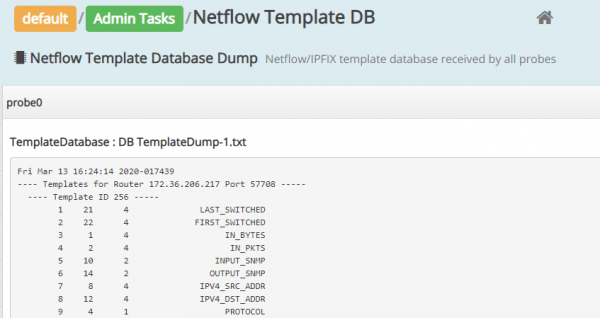
Check whether the Netflow template is displayed. This can be done by using Context:default > Admin Tasks > Netflow Template DB.
Are the templates visible?
Yes. Move to next step.
No. Check the Following.
- Check if Trisul is restarted.
- Check if all nodes are up.
7. Check whether the port number points to Netflow or Sflow
Check if the port number is interpret to Netflow or Sflow.
Is the required port number mapped to Netflow?
Yes. Move to next.
No. Do the Following
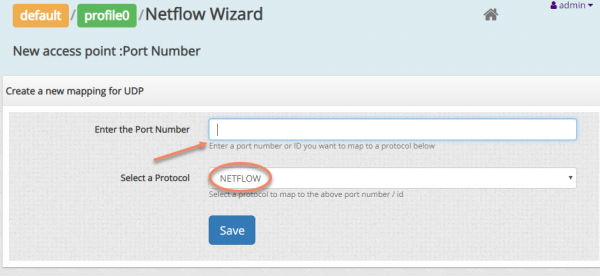
- Go to Context: default > profile0 > Netflow Wizard > Set Netflow Ports.
- Enter the port number and Select “Netflow”.
- Click on Save.
8. Analyse the captured flows
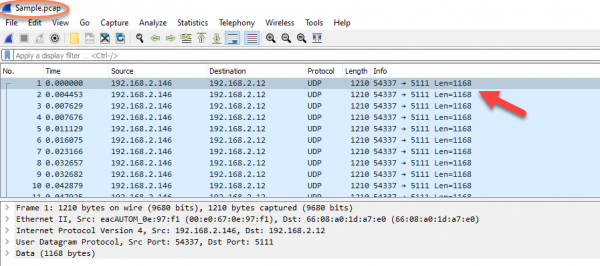
You can analyse the captured flows using Wireshark tool.This can be done by,
sudo wireshark <pcap file>
- Check if you have mentioned the port number correctly.
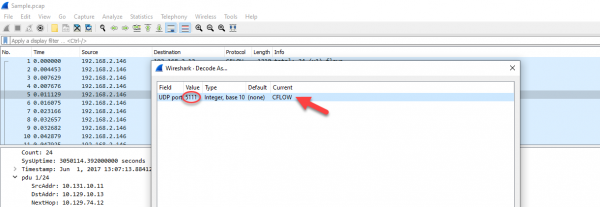
- If not,then choose 'decode as' option by right-clicking on any one of the listed entries in wireshark.
- Change the port number(for eg.5111) and set to CFLOW.
