13.3. Routers and Interfaces
The main tool you will need to work with Device level views of Netflow is the Routers and Interfaces tool. You can select a timeframe, then you will be shown a list of routers with traffic summaries, then you can select a router and see the interfaces, finally you can monitor the interface itself or drilldown even further into hosts , applications, flows on that interface. You can even pull up a Real Time stabber of any of the drilldowns.
To access Routers and Interfaces : Select Netflow → Routers and Interfaces
The Routers and Interfaces Tool
13.3.1 Using the router interface tool
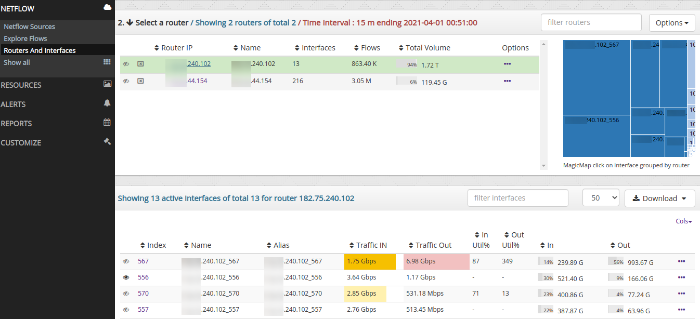
The screen has 4 major parts,
- Time Selector — select a timewindow for the analysis. The default is the most recent 15 minutes. Once you select the time window, that is fixed for all the subsequent drilldowns. Dont be afraid to select large time windows. Trisul can handle it.
- Router Table — table showing list of all routers active in the selected time window. Table shows the number of interfaces active, total volume pushed through the router and other info.
- Magic Map — a visualization of the top interfaces across all routers allows you to directly select an interface. This is also useful to get a view of the relative volumes seen by interfaces across your network.
- Interfaces Table — when you click on a router, the interface table is filled with details about all the interfaces on that router active in the selected time window.
- Interface Alias — whe you want to know the alias name or interface peering details, you can select the ‘Show Interface Alias’ option.
From the interface table there are a number of drilldown options available.
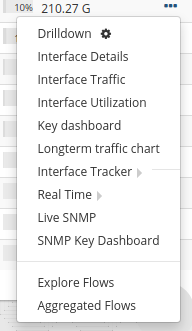
13.3.2 Drilldown from the interfaces table
Having selected a router and interface you can drilldown and access the following by Clicking on the “Options” link
| option | opens | use this for |
|---|---|---|
| Drilldown | Interface drilldown | The most common option What are the Top apps, hosts, conversations, and raw flows on the interface. If you have Interface Tracking enabled you get perfect accuracy even for long term (weeks) analysis |
| Interface Details | Interface Detail | To See the interface details like if-index,if-name,alias,port,ifspeed,etc in one shot |
| Interface Traffic | Real Time Interface traffic Chart | Provides real time Interface usage from Netflow |
| Interface Utilization | Real Time Interface Utilization Chart | Provides real time Interface utiliztion from Netflow |
| Key Dashboard | Interface key dashboard | To see interface metrics, assign name, jump to flows, and traffic analysis at interface level |
| Long term traffic chart | Long term charts | Default 7 day view of interface IN/OUT traffic – 1 chart per day |
| Interface Tracker | Enable | Enables Interface Tracker Enabling this on important interfaces where you wish to get long term reports of hosts and application usage. You can get the bandwidth of every host,application by total,into and out of an interface |
| Interface Tracker | Disable | Disable an interface tracker. Without an interface tracker, you will get only an overview of hosts,apps by total. |
| Real Time | Real Time Utilization | Real time bandwidth chart of interface usage |
| Real Time | Real Time Source Dest IP | Real time view of Source and Dest Hosts active |
| Real Time | Real Time Flows | Real Time most active flows on interface |
| Real Time | Real Time Recv vs Xmit | Real Time charts showing Receive and Transmit bandwidth on that interface (from Netflow) |
| Live SNMP | Charts | Use SNMP to show a 10-sec view of Recv and Xmit traffic on the interface |
| SNMP Key Dashboard | Key Dashboard | If SNMP based metrics is installed , this opens the interface metrics in the SNMP-Interface counter group. |
| Explore Flows | Explore Network Flows | Provides detailed activity of each and every flow in and out of that interface |
| Aggregated Flows | Aggregate Network Flows | Provides all matching flows and show aggregated volumes by hosts, ports, protocols from that interface |