14.2. Explore flows
Fast general purpose search for flows.
The results are presented in terms of
- an interactive visualization based on parallel co-ordinates
- a summary of hosts and application by upload/download, peers
- a table of raw flows
Explore flows
14.2.1 How to search for flows
Search Criteria
You have two ways to enter the search criteria
-
quick search a search expression directly like
destip=twitter.com,port=ssh - advanced search use a form to enter individual fields
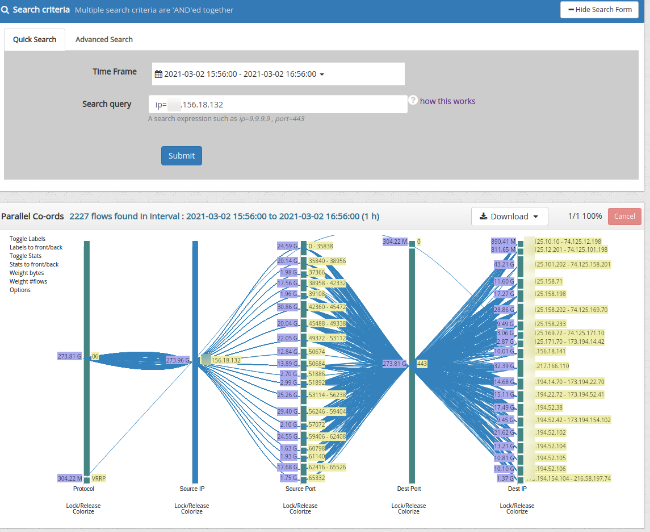
Quick Search: enter search terms directly
Just enter the search expression directly in the text box in the form of
field=value,field=value,…. The supported fields include srcip,destip,ip,net16,n2t24.. The complete list of supported fields can be obtained by clicking on the question mark icon next to the box.
Some common examples :
srcip=208.219.88.129,destip=119.10.181.22 |
All flows between two ips |
ip=208.219.88.129 |
Match both source and destination ip |
port=5700 |
Port 5700 |
proto=gre,ip=208.219.88.129 |
GRE protocol and IP |
tag=UA |
Flow tag has UA (Ukraine) if you’ve set up Flow Taggers |
net24=208.219.88 |
All flows in the /24 subnet |
net16=208.219,port=smtp |
All smtp flows in the /16 subnet |
ippair=192.168.1.8,59.92.15.145 (pipe separated IPs) |
All flows between the two IP pairs |
router=10.0.17.180 |
All router flows |
ifin=1872 |
All the ingress flows in an Netflow Interface |
ifout=1872 |
All the egress flows in a Netflow Interface.Combine with router= or specify router along with the interface in interface key format such as ifout=10.0.17.180_1872 to see egress flows. |
interface=1872 |
All flows in an Interface |
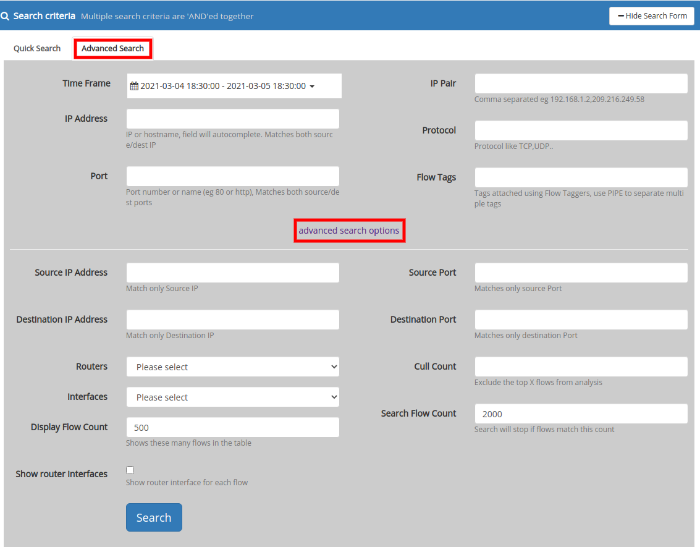
Advanced Search : use a form
Flip to the Advanced Search tab and fill out one or more of the following fields. The direct search method described above allows you to search by many more fields.
| Field | Description |
|---|---|
| IP Address | Enter an IP or host name |
| Flow Tagger | Enter the tag name |
| Port | Enter an application name or port number (example http or Port-80) |
| Protocol | TCP UDP GRE IPSEC etc |
| Flow Source | the router sending the flow |
| Interface Index | the interface index |
| From | From Time |
| To | To Time |
| Source IP Address | Enter the source IP eg 192.168.1.2 |
| Destination IP Address | Enter the Destination IP eg 209.216.249.58 |
| Routers | Select a router from the list of available routers |
| Interface | Select an interface from the list of availbale interfaces |
| Source Port | Enter the value of the source port |
| Destination Port | Enter the value of Destination port |
| IP Pair | Enter two IPs separated by a comma eg 192.168.1.2,209.216.249.58 |
| Cull Count | Leave out the top ‘n’ flows from analysis |
| Display Flow Count | Displays only specified number of flows eg 500 |
| Search Flow Count | Stops search if flows match this count eg 2000 |
Explore flows-Advanced Search
14.2.2 Using the interactive visualization
Trisul features a streaming flow visualization based on the popular parallel co-ordinates paradigm. Search results are automatically streamed into the viz.
This is how you interpret the visualization
- Each vertical axis represents a tuple
- Within each vertical axis the height of each bar is proportional to a particular aggregate value
- By default, the height of each bar is proportional to the volume of data through that item
- Trisul uses an intelligent logic to display thousands of items on each vertical line
- The most important ones, picked out by an algorithm, get their own bar
- The other items considered less important are grouped together
- Each line represents a flow with some or all control points through groups
- Flows are colorized by groups in a control tuple
Controls available
| Lock/Release | Below each vertical axis | Click on release under a vertical axis to ignore the corresponding tuple |
| Colorize | Below each vertical axis | Flows are colorized by source ip. You can change it to get a dramatically different view by looking at different angles |
| Toggle Labels | Top left | Show hide labels |
| Labels up/down | Top left | Push labels below the splines so you can view the flows better |
14.2.3 Export to Excel
You can click on the “Export to XLSX” button to download the report into an Excel spreadsheet containing the same information in a spreadsheet.
- Host IPs
- Readable
- Flows
- Raw Sent Bytes
- Raw Recieved Bytes
- Raw Total Bytes
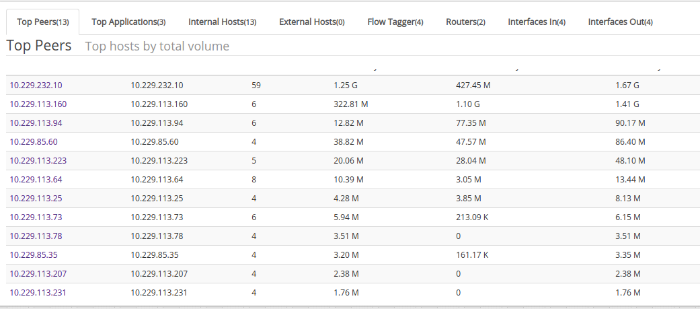
14.2.4 Other data displayed
Below the visualization you can find the following panels
Activity details
- Top peers — Peers (hosts) involved at either end of the flow
- Top Applications — Applications
- Internal hosts — Volume by interal hosts
- External hosts — Volume by external hosts
- Flow taggers — Volume by any tags you have created (see Flow Taggers )
- Routers — volume from each router
- Interfaces In — Volume of Inbound Flows from Interfaces
- Interfaces Out — Volume of Outbound Flows from Interfaces
Flow
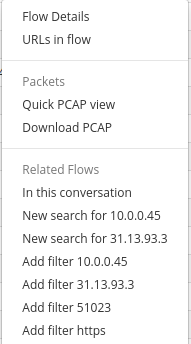
Raw flows
A table containing the top (by volume) raw flows that matched your criteria. You can drill down further in the following manner by clicking on the “Options” button near each flow
| Flow details | Options menu | More details about the flow |
| URLs in flow | Options menu | URL resources for this flow (HTTP only) |
| Download PCAP | Button on top right | Download all the flows shown as a single PCAP |
| Quick PCAP view | Options menu | View first 50K bytes of PCAP in hex and text format |
| In this conversation | Options menu | Get all flows between these two hosts |
| New search for Src IP | Options menu | Get all flows from and to the Source IP |
| New search for Dest IP | Options menu | Get all flows from and to the Dest IP |
| Add filter Src IP | Options menu | Filters flows only from source IP |
| Add filter Dest IP | Options menu | Filters flows only from destination Ip |
| Add filter Src Port | Options menu | Filters flows only from source port |
| Add filter Dest port(http,https) | Options menu | Filters flows only from destination port |
Explore Flows-Options
14.2.5 Per hop flow analysis
By instrumenting your traffic analysis layer to collect packets from various points in your network, you can debug connection problems.
The following diagram shows two Trisul-Probes collecting data from two locations in the network
- probe-FW : collects packets from the firewall
- probe-LB : collects from load balancer

Instrument from different spots
Now when you search for flows in Explore Flows, you will see the same from two vantage points. This helps you spot connection problems in the link between the two points. You can compare the TCP State, Round Trip Time, Number of packets, retransmissions as observed by the probes. The display is shown as below.

View flow hops, notice the table rows and the diagram
How to enable
This feature is automatically enabled when the system detects identical flows from multiple probes.
Trisul scans the search results, reassembles the flows, and presents them in a Hop-by-hop format. You can visually analyze the flow details instantly.
This display is shown in the following cases
- the same flow identified by tuples is seen from more than one probe
- there are a maximum of 10 flows matching, for a maximum of 10 probes