5.5. UI Elements
This section contains a quick overview of the user interface elements used by Trisul.
5.5.1 Menus
A fully customizable multi open collapsible menu system.
Basic operations
- Clicking on menu item opens a page with all options.
- Expanding a menu item opens most popular items.
Trisul remembers the expanded state of the menu per user.
User panel
You can logout, change password, and view the current Trisul Context in the user panel.
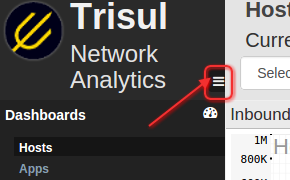
Hiding the menu
You can hide the entire side menu panel.
- Click → gripper or Ctrl+ M.
5.5.2 Dashboards
Dashboards are used to present network analysis modules by placing them on specific locations on a web page.
You can :
- Add / remove / reposition modules.
- Change module parameters.
- Create your own new dashboards.
- Share your dashboards.
For more information see also:
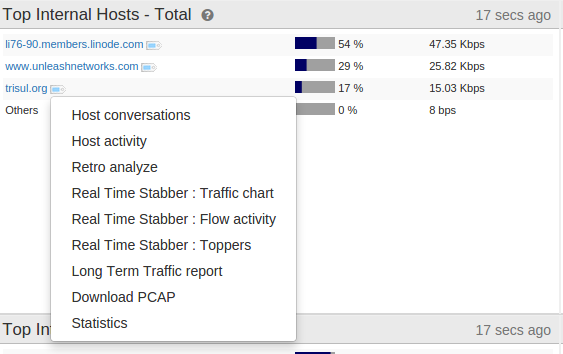
5.5.3 Context Menus
A context menu available can be identified by a little tag next to an item.
The context menu is a very handy way to get around Trisul
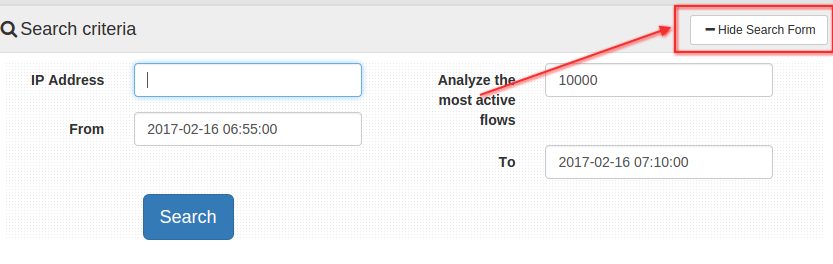
5.5.4 Analysis Forms
These forms have a striped background throughout the app.
- You can collapse the form for analysis results.
- You can expand the form to tweak your analysis.
In the sample form below, you can notice the Hide button on the top right corner.
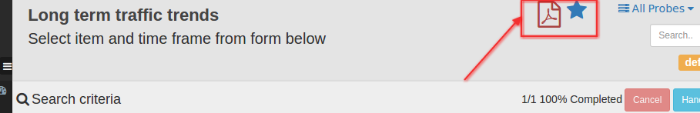
5.5.5 Toolbars
The toolbar area is the big title area at the top.There are two options available currently.
- PDF → Click to convert the current page into PDF report.
- Retro FAQ →Name the analysis and add it to the Q&A
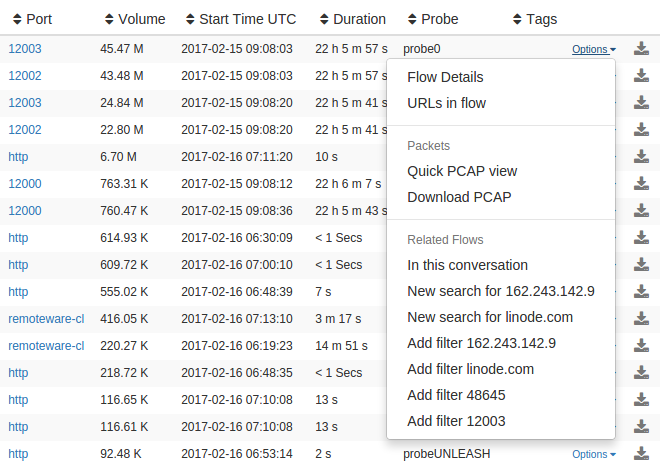
5.5.6 Packets and Flows drilldown buttons
In the sample form below,common cues to indicate that you can view related flows or download a PCAP is mentioned.
5.5.7 Autocomplete
All relevant form fields in Trisul are autocomplete capable. This functionality is triggered when you enter three or more characters.

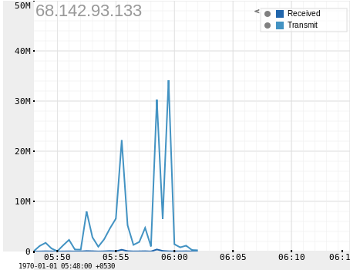
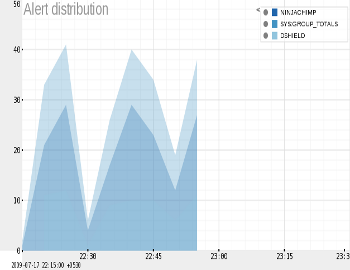
5.5.8 Charts
Trisul supports rich interactive charts. Many modules allow you to select a chart surface and specify other parameters such as width and height.
Interactions
Charts are interactive.
You can :
- Hover your mouse over an item such as a PIE slice and get a tooltip with values
- Click on a chart item and go to the
keydashboard - Click on a chart item in the legend area to
show/hidethe item - Click on the
Expand Legendspot to get a detailed legend - Auto refresh the charts via Ajax calls
The retro chart is even more interactive :
- Click and select an area
- Zoom into a selection
- Pan left and right
- Use the selected time interval to perform drill down retro analysis
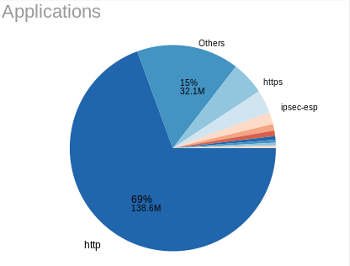
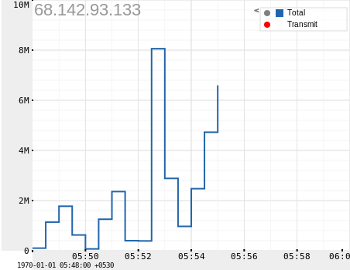
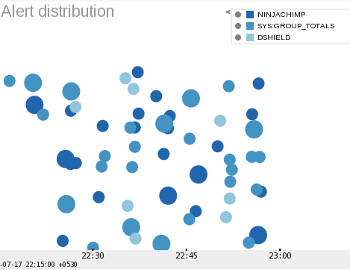
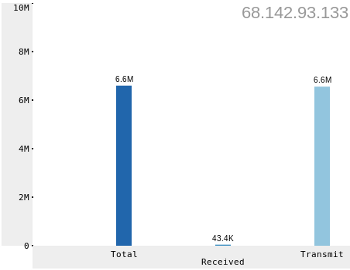
Available surfaces
The following surfaces are available
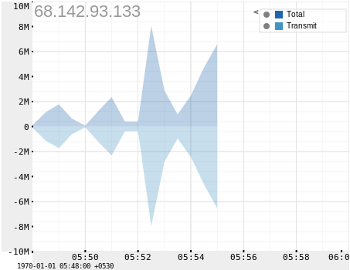
| PIE | BUTTERFLY | |
 |
 |
|
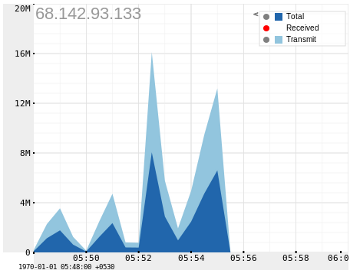
| STACKEDAREA | LINE | |
 |
 |
|
| SQUARELINE | BUBBLE | |
 |
 |
|
| BAR | AREA | |
 |
 |
|
| LINETABLE |
Download PCAP button
On tables featuring a “Download PCAP” button, clicking on the button will result in Trisul computing a “Packet Scan plan” and then downloading all of the requested entities into a single merged PCAP file.
Column select
On tables featuring a “Cols” link, clicking on it will let you choose the columns you want displayed.