Trisul Network Analytics Feature Tour
Trisul Network Analytics is a integrated platform for monitoring your network traffic from multiple angles. Trisul presents our customers with a reliable source of truth for any visibilty, detection, or investigation application. Check out the quick feature tour below to find out more about how we do it.
Network Traffic Monitoring
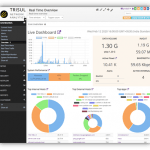
Start tracking hundreds of metrics to understand your network
The first thing you notice when you deploy Trisul Network Analytics is the sheer number of metrics you are able to see. In just a few minutes you will understand your network traffic from multiple angles such Layer2 , IP, TCP, application, flow, perspective. This is essential to build a baseline model of your network traffic. Once you get a solid baseline in place, you can use our extensibility features to fine tune the monitoring.
Build a rock solid network traffic baseline
Basic monitoring All the common metrics you are used to seeing Bandwidth charts, Top Hosts, Top Applications
Layer 2 Keep an eye on your link layer Ethernet metrics, MAC, MAC pairs, broadcast, multicast, ARP, VLAN monitoring
Network Layer Over 100 counters to keep an eye on IP traffic IPv4 hosts and applications by volume, flows, connections, active connections, TCP,UDP metrics, Latency, RTT, Retrans, SYN monitoring etc
Upper layers Application layer DNS, HTTP types, monitoring, BGP, Netflow, Geo location, threats, etc
Encrypted Don't fret, we've got full encrypted monitoring too Track TLS ciphersuits, certificate types, issuers, root CA, algorithms. Client fingerprinting (JA3), SSH, SNI, etc
Advanced Advanced metrics give you more .. Top-K, Bottom-K, Time Series, Cardinality (Unique X of Y), Metric flows (Track X cross Y), flow tracking
Flows provide the master data exchange record
A flow is a unit of data exchange between two endpoints. Trisul tracks all flows either by reconstructing packets or by directly accepting Netflow like feeds. The flow stream in turn generate further metrics, such as Number of Active Flows per Host. Solve common flow query problems like long term queries for common patterns by using Flow Trackers or add any tag using Flow Taggers.
Packet storage
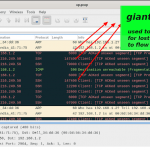
PCAPs or it didnt happen. It is a common theme in network analysis. Today's security and network analysts demand to see packets to close investigations. Trisul tucks away raw packets as they are being monitored and indexed them for later forensics usage. The challenge of doing this at scale has been solved using flexible rules to just keep the traffic you really need.
Integrate with IDS alerts coming off third party systems
Intrusion detection is still a must have weapon in your defensive arsenal. Trisul supports a side stream of alert events from IDS such as Suricata or other IPS, FIrewalls. This stream enriches the main pipeline processing. So you can do fun workflows like ``Show me all flows that had a Major alert , then pull out a PCAP of those``.

Collect and search of richer information exchanges
Metadata consists of documents pulled out of network traffic by Trisul. These include SSL Certificates, DNS Records, URLs visited along with the Params, any files transferred. With these you can run long term queries that would be prohibitively expensive from packets.

Explore relationships between metrics effortlessly using Trisul EDGE
Trisul EDGE is a feature set that provides graph analytics capabilities. While building the metrics pipeline Trisul also creates a new stream of Edges and Vertices. These are reassembled into full graphs. They help you explore relationships. If you see a SHA1 certificae metric you can open up the graph and explore which Organization uses it, which IP addresses transferred data with it, then expand the IP themselves to pull out the flows, and so forth. A very powerful feature that pulls everything together.

Minimize blind spots with hi-res monitoring
Do you know that you saw a never before seen TLS Certificate type today? Do you even know how much of your traffic is TLS 1.3 vs older versions? Do you know how many internal hosts are active at the moment? These are blind spots you get when you deploy legacy monitoring tools. Trisul runs your packets and netflows through a real time streaming analytics pipeline containing dozens of analytics algorithms which pull out hundreds of such metrics. You can write your own analytics using our LUA API too.
Tech highlights
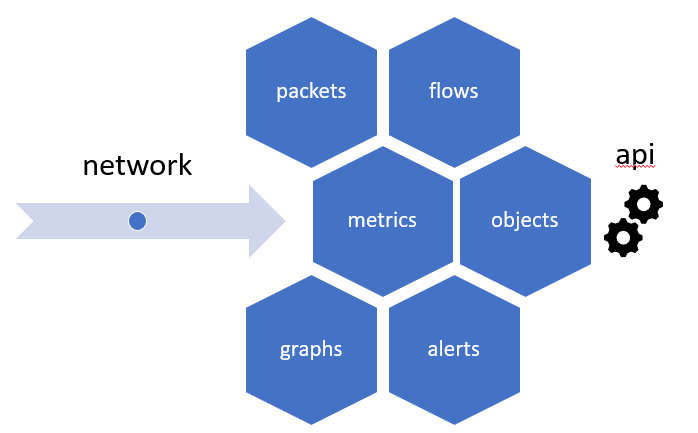
Trisul integrates a number of network monitoring technologies on a single platform. Find out in which class of products comparable features can be found.
Feature | Trisul | Compared to other network monitoring solutions |
Available as software package, Docker image, hardware appliance | Common in other tools too | |
Basic traffic monitoring like bandwidth usage , top IPs, apps | Usually found in SNMP based tools | |
Advanced metrics across Layer 2 to Layer 7 | No comprehensive solution. Some tools generate limited visibility from logs. | |
Open APIs | Trisul is the only product offering an fully open API for analytics and queries | |
Integrated packet storage | Usually found in standalone appliances in a different platform | |
Large scale data handling and lossless historical queries | Most offererings roll up timeseries metrics and truncate full flow storage to keep their database size compact. | |
Deep Integrations with IDS/IPS/Firewall logs enrich the metrics and flows. | Usually standalone products, integrations may be limited to viewing on a single dashboard. | |
Graph Analytics | Not found in other network monitoring products today | |
Large scale Netflow/SFLOW monitoring | Commonly found as add-on modules to basic enterprise SNMP monitoring solutions. | |
Trisul includes eveything you need including a purpose built database backend and runs on Linux | May have to acquire OS and database licenses separately |