Baselining and hunting with Trisul
If you were to walk into a strange network, you would want to first see what the typical characteristics of the network are. You want to know what the bandwidth usage is, what applications are inuse, how many flows are seen per day, alert activity, and so on. This is known as “baselining”. The term “hunting” is a new term I found on twitter. It refers to actively poking into your traffic with various tools in order to detect suspicious activity. Without a rock solid baseline, you simply arent going to do an effective job of hunting. It turns out Trisul is great at both these tasks.
Entry points for Baselining
Say you had a corpus of 500GB of packet captures you loaded into Trisul. Where do you start ? Here are some entry points you can use.
| Traffic | See bandwidth usage for the past week, identify patterns, busy periods, spikes, plot number of flows, drilldown into busy periods, …. |
| Alerts | Examine IDS alert activity, see what the relevant ones are, move to flows, packets, traffic for hosts, trends for alerts…. |
| Toppers | Top users at IP layer, Apps, Alert Signatures, MACs, Countries, IP protocols, … |
| Flows | See top flows for past week. Check top downloads, uploads, volume, Label flows by country, ASN, move from flows to packets, and URLs |
We have an online demo of a 500GB data set. Please send a tweet to @vivekrj for access.
How to use
No boring text, just instructions and screenshots of the above 4 entry points.
Traffic Entry
- Select Retro
- Use the Toolbar to select “Weeks” to show last 4 weeks of data
- Observe the activity periods
- Select a tool from below – Recommend the “Top 100 flows” and “Busiest Hosts and Apps” to start
Tip The yellow background indicates the time where full content is available

Alerts Entry
- Select Dashboard → Real Time Alerts
- Select Timeframe → Last 4 days to see the maximum data
- The discreate chart scales give enough visibility to the low volume alerts
- Notice the alert types, click on a bubble to see list
- Click on the counts in Aggregated Alerts to drilldown
- Recommend adjusting the Pivot to see different views of alert activity


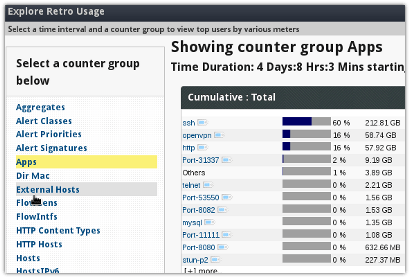
Toppers Entry
- Select Retro → Retro Counters
- Select Weeks to expand the time interval to last 1 month
- Click on a counter group
- Recommend “Hosts”, “External Hosts”, “Apps”, “Network Layer Stats” to start with
Tip Click on the little label next to each item for drilldown

Flows Entry
- Select Retro –
- Select Weeks to expand the time interval to last 1 month
- Select Flow Tracking from the list of tools shown
- Recommend “Traffic” for big flows, “Transferred In” for Downloads, “Out” for uploads

Once you get familiar with the above basics, you can explore additional characteristics like flow rate, flow creation rate, URLs, Domains, advanced counters and so on.
In the next post, we will explore hunting featuring Trisul tools like Payload Search, Cross Drill, Flow Tagging and more.

Download Trisul 2.6 for Ubuntu or CentOS today. You can do all this for free for the latest 3-days.
