Trisul updates for easier alert viewing
Hey all, we have a new Trisul update with some significant enhancements.
Security Changes
The backend webservers now run as trisul.trisul or as the user specified in the config file.
The backend servers of older releases were running as root. This is obviously a bad thing but we did that because we wanted the user to be able to start Trisul from the web interface. That task required root because Trisul needs to open network adapters. Now the trisul executable has been setuid root. If you dont want that you can unset the setuid bit and choose to startup Trisul by hand.
New goodies
Alert grouping
When you view alerts, Trisul will show a bar on top aggregating results in a number of ways. This allows you to navigate large alert sets easily.

Fig: Large data sets are shown grouped at the top. Allows you to drilldown easier.
Show rule
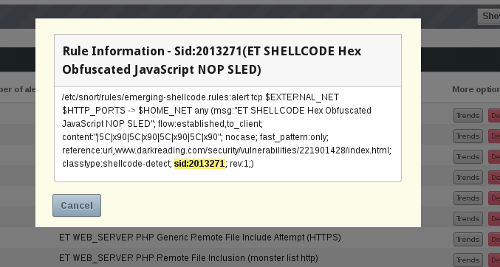
When viewing an alert you can click on “Lookup > Show Rule” to see the rule that triggered it. A nifty little addition that can boost your productivity.

Fig: Click on an alert to show the rule that triggered it
New TRP feature to show volume
Do you want a script to tell you the volume of data transmitted for HTTP ? Or volume to Russia over the past week ? TRP has a new way to retrieve data volumes fast. We added a sample on our new github repo called “getvolume” that shows you how to do this. We also refreshed the demo certificates which are going to expire shortly.
CopyEnter PEM pass phrase:
Volume of Meter 0 (Total) HTTP Traffic  = 222134520 bytes
[vivek@localhost trp]
Enjoy Folks !

Download Trisul today. Dont just monitor, start NSM-ming !
