Trisul Network Analytics Feature Tour
Learn about the key features behind Trisul.
Monitor, analyze, and respond in real-time with Trisul’s advanced streaming analytics and automated threat detection.
BENEFITS
Visibility
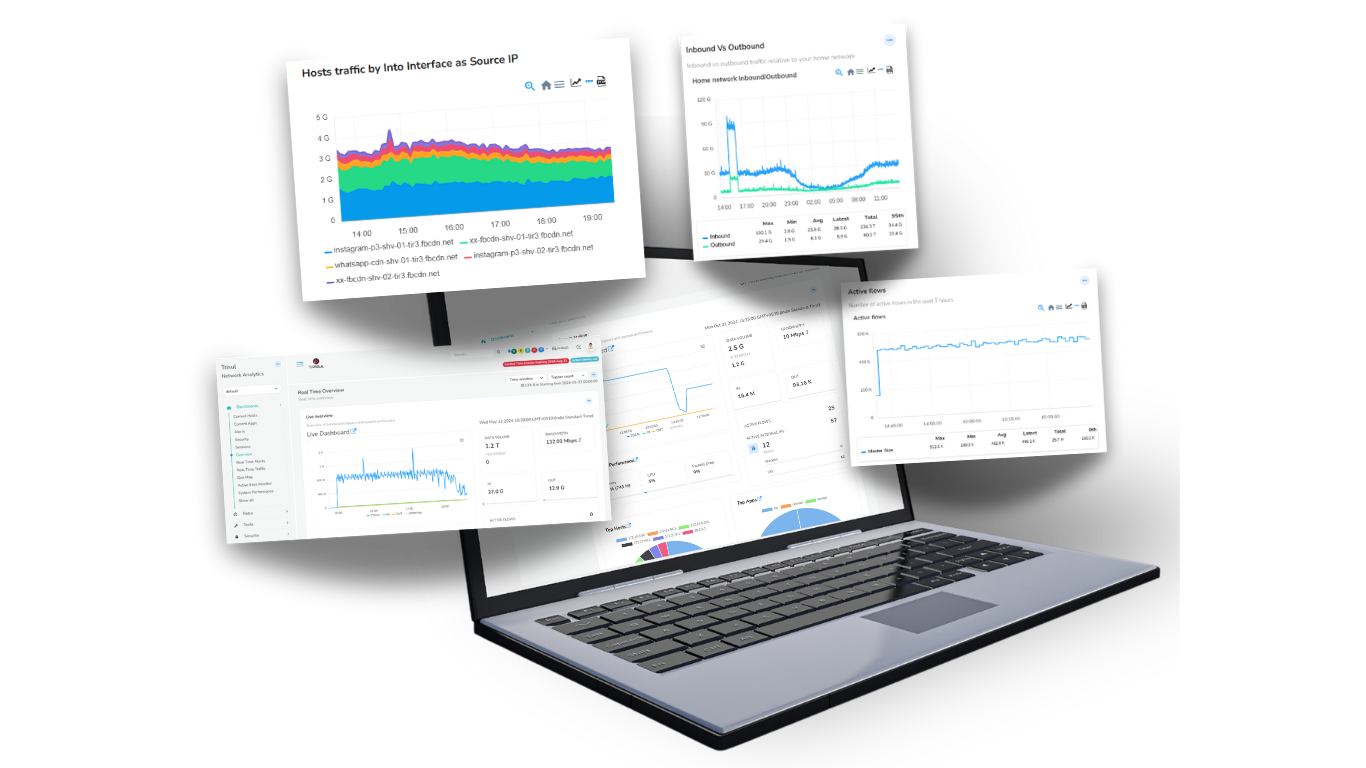
With over 200 built-in network traffic metrics, top talkers, flow analytics, and the option to create custom metrics, you gain a comprehensive 360-degree view of traffic.
Detection
Get notified immediatly with our powerful ML-based anomaly detection, threat detection via feeds, signature based IDS, and flow events.
Investigation
Store traffic metrics and flows at the native resolution. This serves as a single source of truth for your entire enterprise. You can rely on this for any incident response.
NETWORK TRAFFIC MONITORING
Minimize blind spots with hi-res monitoring
Do you know that you saw a never before seen TLS Certificate type today? Do you even know how much of your traffic is TLS 1.3 vs older versions? Do you know how many internal hosts are active at the moment? These are blind spots you get when you deploy legacy monitoring tools. Trisul runs your packets and NetFlow through a real time streaming analytics pipeline containing dozens of analytics algorithms which pull out hundreds of such metrics. You can write your own analytics using our LUA API too.
OVER 200+ METRICS
Metrics
Metrics are the base! The first thing you notice when you deploy Trisul Network Analytics is the sheer number of metrics you are able to see. Get a 360-degree view of your network traffic in just minutes, covering Layer 2, IP, TCP, application, and flow-level analysis.
You cannot optimize or secure what you can’t see
Trisul generates hundreds of metrics at all layers of the network continuously, computes the most important views of these metrics, and stores them. All in real time! What you get is the world's best available visibility into current and historical network traffic. Your teams can confidently perform monitoring, reporting, incident response, and detection of metric outliers.
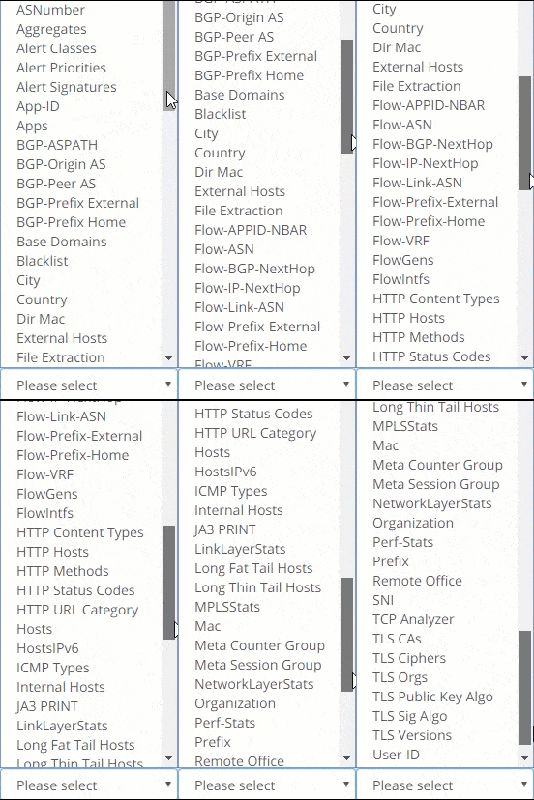
Metrics from Layer 2 to Layer 7
Basic Monitoring | Essential network performance indicators | Bandwidth charts, Top Hosts, Top Applications |
Layer 2 | Critical metrics at the datalink layer to watch out for | Ethernet metrics, MAC, MAC pairs, broadcast, multicast, ARP, VLAN monitoring |
Network Layer | Over 100 counters on IP traffic | IPv4 hosts and applications by volume, flows, connections, active connections, TCP,UDP metrics, Latency, RTT, Retrans, SYN monitoring etc |
Upper Layers | Essential metrics in application layer | DNS, HTTP types, monitoring, BGP, Netflow, Geo location, threats, etc |
Encrypted | End-to-end encrypted monitoring solution covering all aspects of encrypted traffic | Track TLS ciphersuits, certificate types, issuers, root CA, algorithms. Client fingerprinting (JA3), SSH, SNI, etc |
Advanced | Expert level insights with advanced metrics | Top-K, Bottom-K, Time Series, Cardinality (Unique X of Y), Metric flows (Track X cross Y), flow tracking |
Counter Groups
Five custom counter groups help you create metrics that are tailor made for you
Filtered Counter Groups help you track a subset of a parent group by filtering by a second group.
Applications on Subnet 192.168.2.0/24
Takes the Applications counter group and filters it by the Hosts Counter Group with the filter criteria 192.168.2.0/24
Benefits
Zoom in on a particular set of items separately.
Keyset counter groups are a generic way to aggregate and count. This is known in some industry circles by the narrow rigid term “IP Groups”
Example : Count http,https,port 8080 as WEB
Take the Application Group then combine the keys http,https,8080 and assign a new key WEB to that group.
Benefits
Count aggregates rather than individual items for grouping purposes.
Only count items from a parent counter group where a metric value matches a control range.
Example : Intranet Applications
Takes the Applications counter group and filters it by the Internal Traffic > 0
Benefits
Only focus on items with certain metrics properties.
Flexible rules involving multiple counters
Example: Count all applications to Port 443 on IP 10.0.12.12 as SAP
Takes the Applications counter group and adds a Host based rule
Benefits
Adapt metrics to your organizations applications.
Cardinality meters can be added to any counter group. This allows you to count Unique X or Y.
Example: Unique applications for each Host
Takes the Hosts counter group and add Apps as the cardinality metric
Benefits
Monitor uniques
Use this to track metric flows. Formed by a cross product of upto 3 different counter groups.
Example: Internal-Hosts X Applications
Combines the Internal-Hosts and Applications counter groups to create a cross product;
Benefits
A powerful way to track information flows.
Trisul Edge, The Streaming Graph Analytics
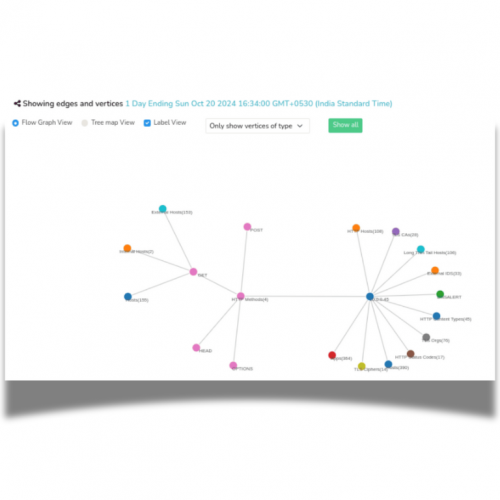
Trisul EDGE is a feature set that provides graph analytics capabilities. While building the metrics pipeline Trisul also creates a new stream of Edges and Vertices. These are reassembled into full graphs. They help you explore relationships. If you see a SHA1 certificate metric you can open up the graph and explore which Organization uses it, which IP addresses transferred data with it, then expand the IP themselves to pull out the flows, and so forth. A very powerful feature that pulls everything together.
Legacy Limitations
Traditional network monitoring systems provide limited metrics on bandwidth usage on a port, IP, or protocol basis often constrained by database capacity. This leads to optimizations such as data summarization, rollups, and discarding low-usage data. Upon investigating you would find that the exact metric you need has been discarded as low value potentially omitting critical information.
Modern Capabilities
Trisul revolutionizes network monitoring by leveraging advanced technologies to capture and store vast amounts of metric data without compromising resolution. Its high throughput backend enables small businesses to generate and retain millions of datapoints, ensuring unparalleled visibility and reliability.
Trisul Network Traffic Monitoring
Available as software package and hardware appliance |
Basic traffic monitoring like bandwidth usage , top IPs, apps |
Advanced metrics across Layer 2 to Layer 7 |
Open APIs |
Integrated packet storage |
Large scale data handling and lossless historical queries |
Deep Integrations with IDS/IPS/Firewall logs enrich the metrics and flows. |
Graph Analytics |
Large scale Netflow/SFLOW monitoring |
Trisul includes eveything you need including a purpose built database backend and runs on Linux |
Other Network Monitoring Solutions
Common in other tools too |
Usually found in SNMP based tools |
No comprehensive solution. Some tools generate limited visibility from logs. |
Trisul is the only product offering an fully open API for analytics and queries |
Usually found in standalone appliances in a different platform |
Most offererings roll up timeseries metrics and truncate full flow storage to keep their database size compact. |
Usually standalone products, integrations may be limited to viewing on a single dashboard. |
Not found in other network monitoring products today |
Commonly found as add-on modules to basic enterprise SNMP monitoring solutions. |
May have to acquire OS and database licenses separately |
FLOW MONITORING
Trisul tracks and stores all flows without any loss.
Flow analysis, enrichment, querying capabilities are a must for any organization serious about monitoring, investigation, and audit.
Flows
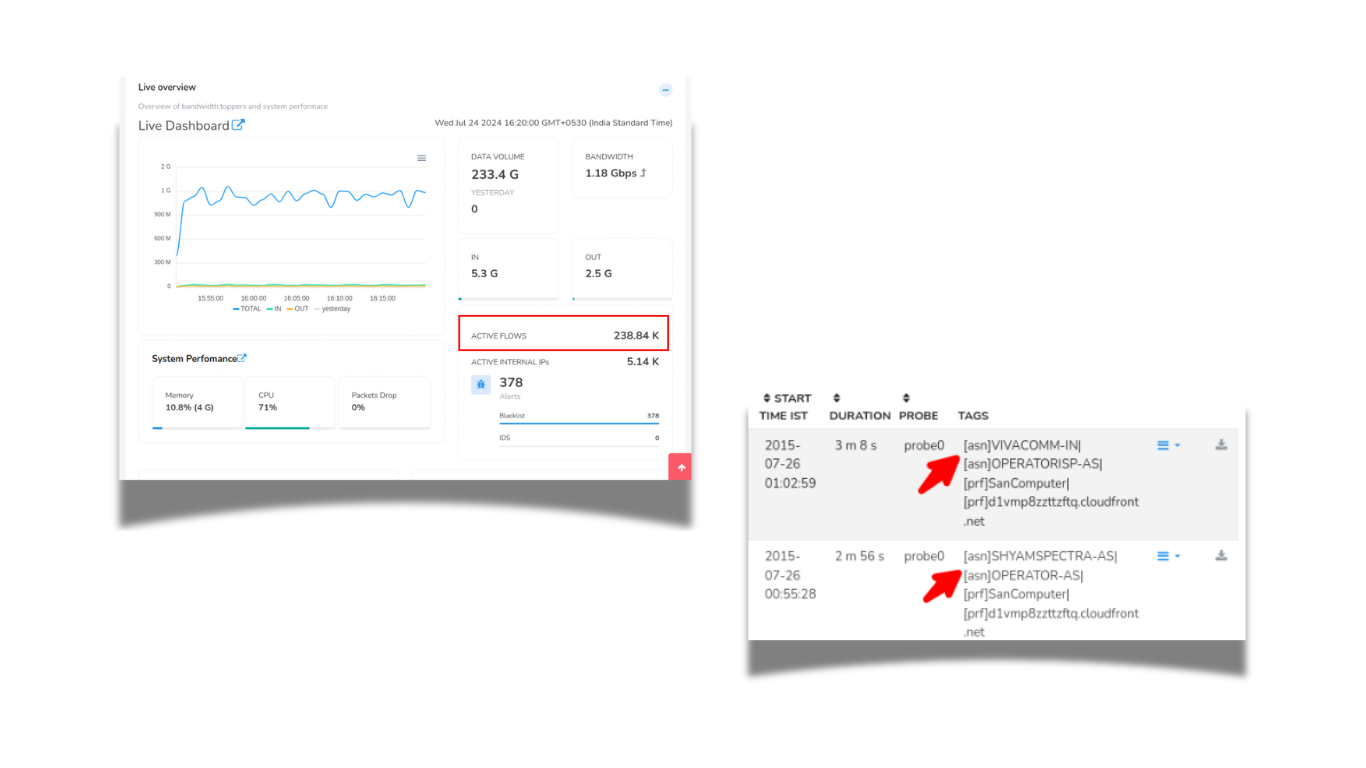
A flow is a unit of data exchange between two endpoints. Trisul tracks all flows either by reconstructing packets or by directly accepting NetFlow. The flow stream in turn generate further metrics, such as Number of Active Flows per Host. Trisul's custom built database stores every single flow, this enables you to query for any flow activity based on any parameter. Tools like Flow Tagger and Flow Tracker help you query more efficiently over long time frames.
Crunch Your Flows
Flow analysis, enrichment, querying capabilities are a must for any organization serious about monitoring, investigation, and audit. Trisul tracks and stores all flows. No losses.
- Reconstructs and saves all flows
- Available in NETFLOW and PACKET mode
- Powerful Device Interface drilldowns
- Flow enrichment with Flow Taggers
- Fast Flow DB supports Billions of flows
Explore
Explore Flows using a simple query language
Flow Taggers
Create flow taggers to enrich flows with counter information. Eg ; tag flow with country codes of endpoint, or IDS alert priority
Aggregate
Query the flow database and aggregate key usage.
Flow Trackers
Real time streaming snapshot of top flows matching a criteria. Eg Top Downloads
XLS Export
For large outputs such as compliance and audit. Query and export flows as XLS.
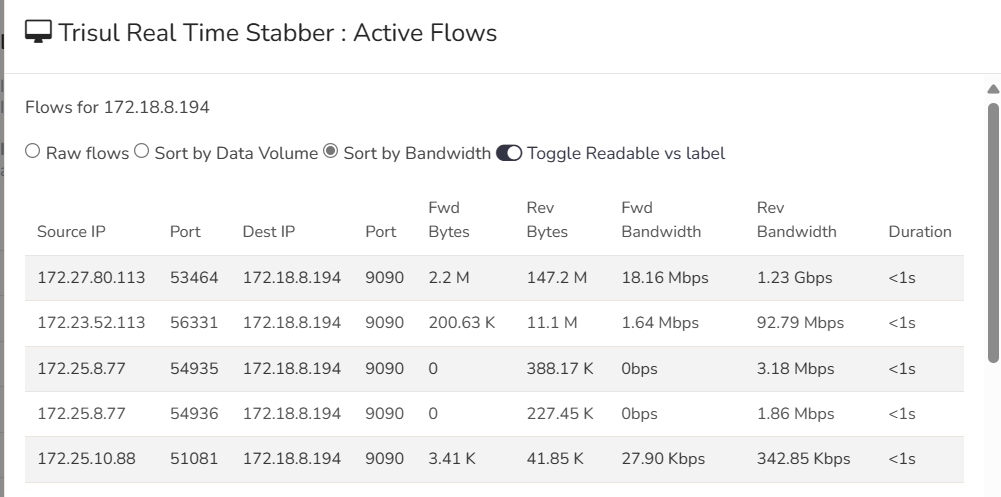
Flow Stabber
Monitor flow activity in real time on a particular interface, for an application, etc.
PACKETS AND PACKET STORAGE
PCAPs or it didn’t happen. It is a common theme in network analysis. Today’s security and network analysts demand to see packets to close investigations. Trisul tucks away raw packets as they are being monitored and indexed them for later forensics usage. The challenge of doing this at scale has been solved using flexible rules to just keep the traffic you really need.
Packet storage and recall
As Trisul meters network traffic, it continuously saves raw packets for future analysis.The ability to call upon raw packets, or full content, is key to the practice of Network Security Monitoring. Raw packets is not just useful for security applications but also for network performance troubleshooting. For example, you can pull up ARP/Spanning Tree packets which can help you nail a layer 2 issue.Packet Capture Basics describes the design of in greater detail.
Optimized packet storage requirements
One of the major challenges of real time packet storage is concerns about the disk throughput and storage requirements when handling busy links. Make use of Trisul’s sophisticated techniques to dramatically reduce the packets you need to store. Using the Trisul LUA API you can even control packet storage policy at a granularity of flow.
Streamlined PCAP drilldown workflows
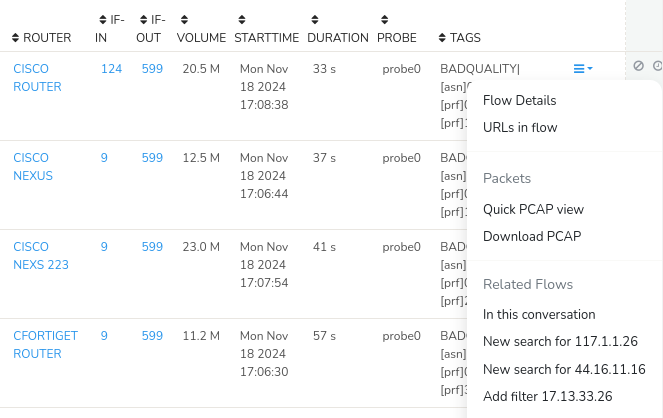
Most objects in Trisul can be drilldown to raw packets with the click of a single button.

Quickly dive to PCAPs
Flows, alerts, resources to PCAP
Merged PCAP
Consolidate results of investigation into a single merged PCAP automatically
Reduce disk of older PCAPs
Built in pruning tool compresses older PCAPs by flow size
Encrypted by default
Stay secure ! Trisul stores packets encrypted
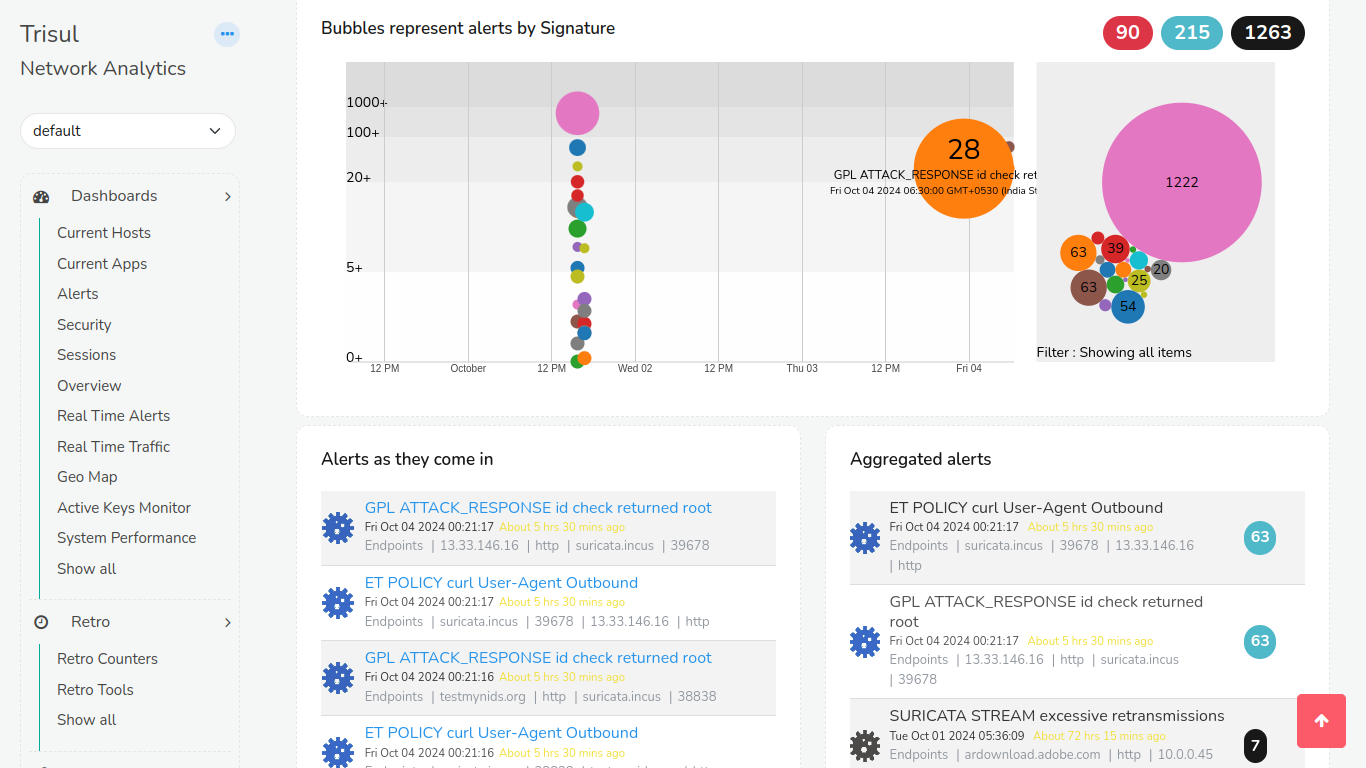
IDS
Integrate with IDS alerts coming off third party systems
Intrusion detection is still a must have weapon in your defensive arsenal. Trisul supports a side stream of alert events from IDS such as Suricata or other IPS, FIrewalls. This stream enriches the main pipeline processing. So you can do fun workflows like ``Show me all flows that had a Major alert , then pull out a PCAP of those``.
EXTENSIBILITY
Write your own scripts to accomplish almost anything.
We know how frustrating it can be when you know exactly what you want but your network monitoring software is closed and unable to support that. With our LUA API you can write scripts that plugin deep into the Trisul Engine, while the TRP API lets you work with the database. Trisul supports a distributed deployment model for scaling out to the largest networks.
Analytics API (LUA)
The platform provides you with hooks into key processing points in the packet processing, reassembly, and the metrics stream pipelines. You write simple scripts using LUA to examine the available streams and add your own analytics.
Database API
A Protocol Buffers based request response API. Retrieve any type of data from the Trisul backend such as metrics, flows, documents, and packets. The API can be accessed from any scripting language that supports Google Protocol Buffers. We like to use JavaScript and Ruby.
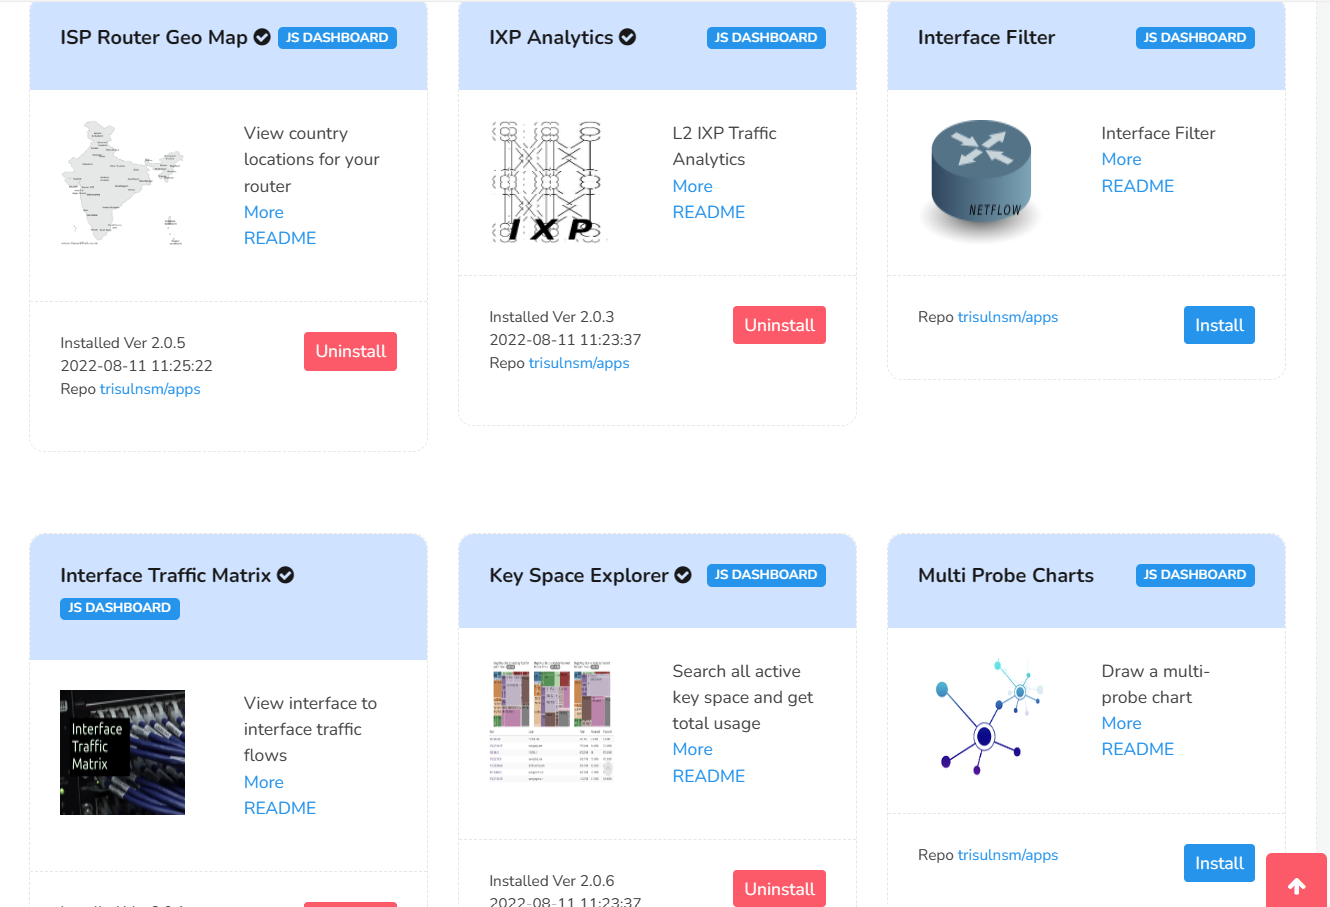
Trisul Apps
Trisul Apps are a fast growing collection custom analytics algorithms, tools, dynamic dashboards, and visualizations made freely available to our community. Trisul Apps are created using the open APIs and the source code for them is made available on Github.
Scalable Architecture
A Trisul Monitoring domain consists of Probes and Hubs. Probes process packets , run streaming analytics on them, and send the metrics to the Hub. The Hub provides the database and web server functions. CLI tools help you put together a monitoring topology of this sort.
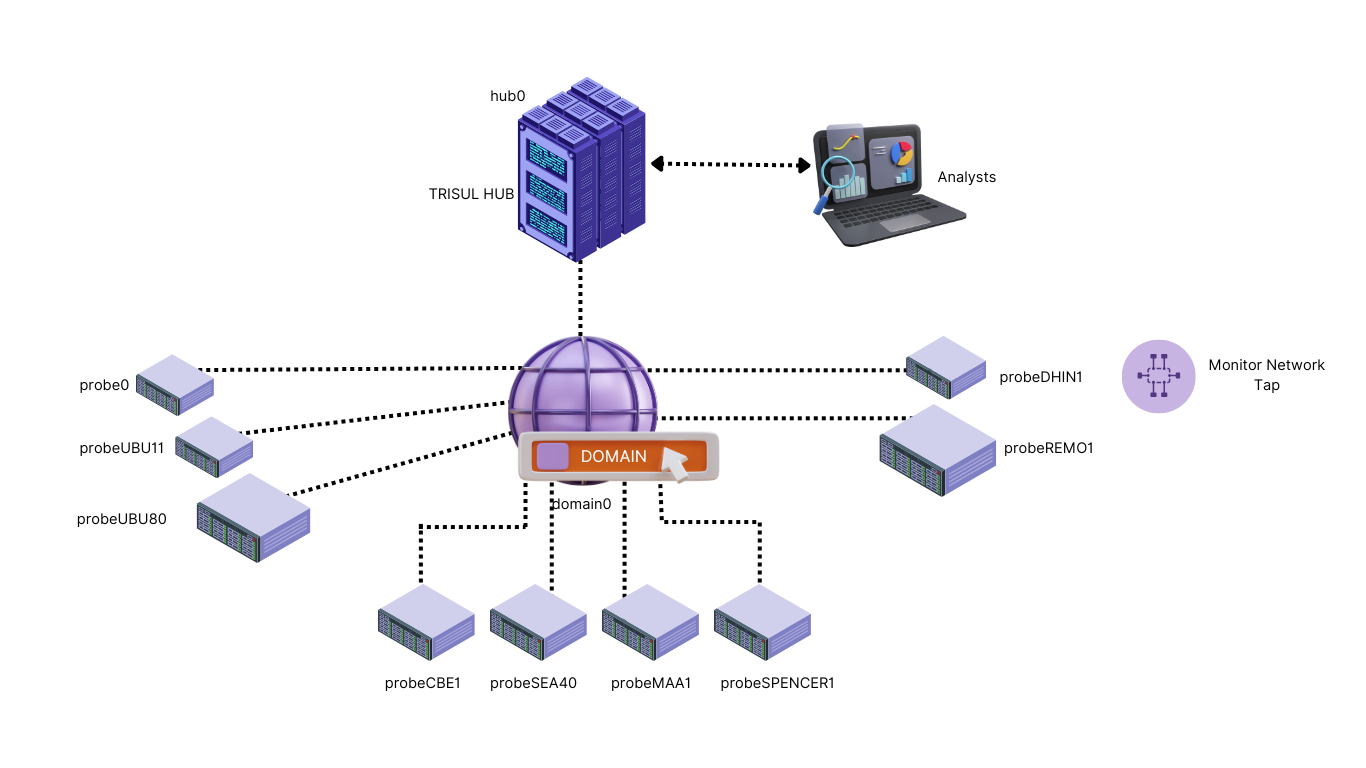
Merged and probe views
While investigating you can restrict the views to a single probe or to the consolidated view of all probes.
High Availablity
Trisul supports High Availability options and Disaster Recovery backup site configuration for enterprise customers.
Scale out
A distributed monitoring network of probes and hub nodes with powerful CLI management tools from a central location.
Hot add
You can add, remove, start, stop, upgrade probes online without downtime of the other components.
CLI Tools
CLI tools can perform all administrative tasks from a single console.
Multi hubs
Very large deployments can also add multiple hubs. The query layer can hive off queries and consolidate them.

