Threshold Band alerts and other exciting features released in Trisul Network Analytics 5.5
We are happy to announce a new release of Trisul Network Analytics with exciting new features that make it even more effective in deep streaming analytics of network traffic.
Threshold Band alerting [ docs ]
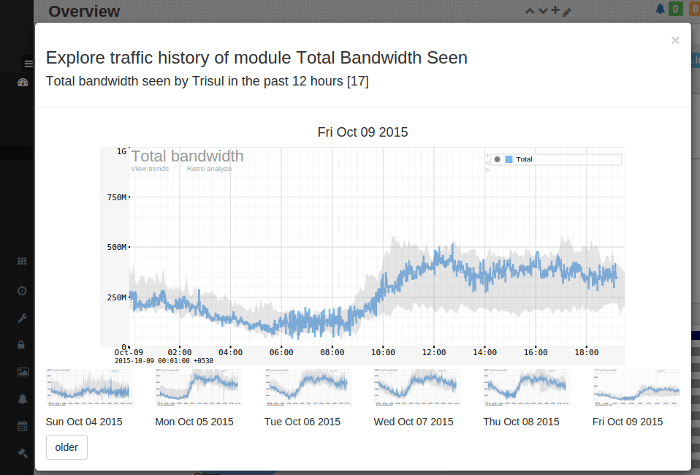
We sat down with a few of our customers with the most sensitive networks and observed how various Traffic Metrics were responding to real life situations. This helped us develop a simple yet effective “Threshold Band” feature that we are releasing now. Essentially Trisul now lets you attach ‘threshold bands’ to any metric. Once you attach a band, Trisul automatically calculates an upper and lower bound for that metric for each time-of-day and day-of-week combination. The concept itself is old, but we have made it really easy to attach any metric to a band, which is automatically recomputed every night.

Currently we are using this to alert on statistical movement of a number of metrics such as
- total bandwidth
- concurrent flows : helped detect a DoS situation
- netflow volumes
- volumes of top 3 customers with revenue impact : if traffic below lower bound results in $ loss for them
- number of flows being setup up / sec
- number of flows terminated / sec
You can track any of the hundreds of thousands of metrics this way. In our next maintenance release, we are rolling out a
Read more about this feature in our Threshold Band Anomaly alert docs
Self monitoring
A new dashboard called Perf Stats now tracks metrics about Trisul’s own memory, CPU, disk usage. Quite surprisingly spikes in these third order metrics have led us to interesting findings.

Active Keys Monitor
A new dashboard keeps track of how many unique keys (entities) are being monitored in each counter group. The use cases are to get a really good visibility of ‘unique things’ in your network from various viewpoints. Trisul can also track Unique X or Y using Cardinality counters. See the post on Hyperloglog counters

New historical chart use interface
Now you can click on the ‘chart’ icon on any module to expand the chart to days or weeks.


Other changes
On the backend there are several exciting changes
- LUA Scripting functionality has been added to counter group items
- Automatic recovery of crashed databases in rare cases of power failure
- New Netflow dashboards
- New License page
- Many UI fixes such as the ability to add any item to the menu in a single click

Free Download Trisul 5.5
Download Trisul 5.5 today Spend your time on interesting problems not fighting tools.
