9.9. Threshold Band Anomaly alerts
NEW
Trisul can look at long term history of any metric and compute a band within with the metric is usually found.
The band
- is computed for every 5 minute interval
- day of week based so weekends are tracked separately
- can handle holidays and spikey days
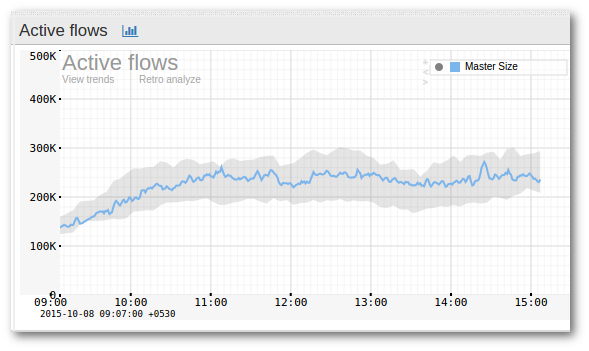
The screenshot below shows a metric (Active Flows) for which “Threshold Banding” is enabled. The band is shown as a grayish background while the actual metric is shown as the curve.
9.9.1 How it works
The feature is enabled by two separate processes.
Band computation
The most important part is how the bands are computed. Currently there are two options.
- Day of week based : This compares a Wednesday only with other Wednesdays and excludes outliers. This features requires at least 3 weeks of training data.
- Simple : Compare with yesterday.
Metrics and automatic computation
You select any of the metrics available in Trisul and decide to use Threshold Banding on it. This requires you to select a metric which is identified by a counter group, a key, and a meter id.
Once you enable Threshold Banding on a metric, Trisul automatically updates the band every night as time passes to take into account recent trends. There is no configuration required to do that.
Band alerting
The band computation process pre computes expected range of values for a particular metric for each time interval during the day. Trisul continuosly checks if the metric is within the expected band for that day and time period. If it is out of bounds it generates “Threshold Band ALert”.
9.9.2 Configuring
Creating a new Threshold Band Anomaly monitor for a particular counter
There are two ways
Method 1
Method 2
The following fields are shown in the form
Basic settings
You must fill this up. If you came to this page from the Key Dashboard the fields are already pre-filled.
| FieldName | Description |
|---|---|
| Counter Group | The counter group. |
| Stat ID | Meter within the counter group |
| TargetKey | The key within the target counter group on which you want to create a Band. You can enter this in either human readable format eg:Port-80, 192.168.1.33 or in Trisul key format: p-0050, C0.A8.00.01 |
| Compare Day | If Checked – use Day Of Week based band computations. If Unchecked – use yesterdays data to compute a band. NOTE You need a licence for Day Of Week band because it needs 3 weeks of training data |
Advanced settings (optional)
Use this section to fine tune the band computation algorithm.
| FieldName | Default | Description |
|---|---|---|
| Number of samples | 1 | The number of samples used to compute the band. The default is 1 which means last Wednesday will be compared with this Wednesday. If you set this to 5 last 5 Wednesdays will be used to compute expected band. The default is 1 so that our users can quickly use this feature without requiring many weeks of training data available. |
| Bucket Size | 300 | The width of each interval. |
| Exclude Upper | 0 | For each interval exclude this many upper samples. Set this to 1 to exclude 1 upper outlier |
| Exclude Lower | 0 | For each interval exclude this many lower samples. |
| Margin upper | 10 | Margin of allowance on the upper side before alert is generated |
| Margin lower | 10 | Margin of allowance on lower side before alert is generated |
Then press the “Compute Band” button. This could take a few minutes. Once it is completed the band will be shown below.
Cron
Once a band has been created. It is automatically updated by a special cron task every night. There is no further configuration required.
9.9.3 Viewing alerts
Once an anomaly is detected Trisul generates an alert, similar to an Intrusion Detection or Flow Tracker alert. This appears in the top right panel.
Alerts view
- You will now see a table listing all the alerts
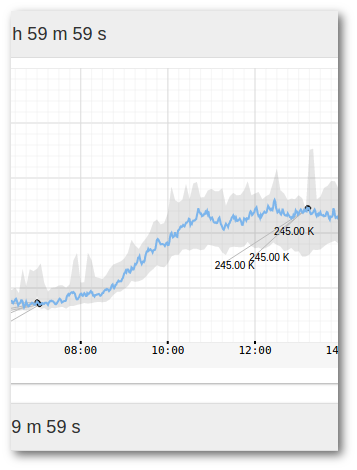
- Click on view threshold band to bring up a chart showing where the alert occurred
Alerts are indicated by a label. You can either ignore the alert if it is just over the band or you can take immediate action if the metric changes dramatically.
9.9.4 Deleting alerts
The default approach of Trisul is not to delete anything. TCAs just rollover as they age out.
If you wish to delete all alerts for a particular band, you can delete the band itself. That deletes all the alerts, then you can recreate the band.