11.1. Reports
Trisul comes with dozens of pre-defined reports for your use. You can either view them on the browser or send them via email periodically.
Accessing reports
The central place where all reports can be accessed is via the Reports menu. You can also download various reports in CSV or PDF formats in different sections in Trisul.
Select Reports in the left menu section
Creating your own reports
Using the Trisul Remote Protocol API you can write Ruby scripts that create your own reports.
11.1.1 Report time
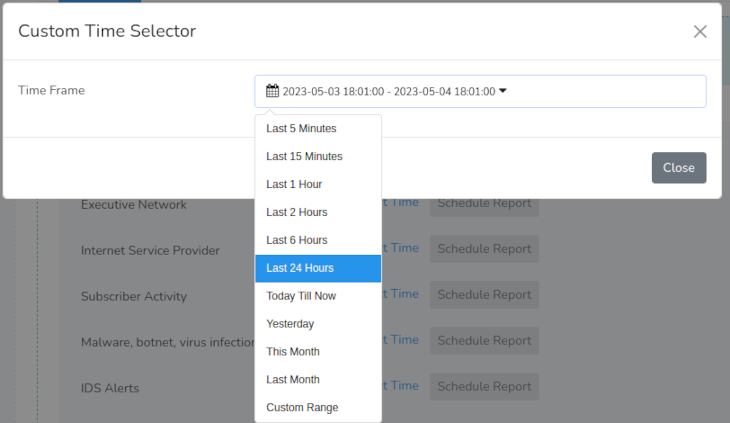
For each report type, you can easily select a number of predefined time windows as shown in the image below

Report
You can also click on “Custom” to select any time window of your choice.
11.1.2 List of reports by type
Report types
- Executive — At a glance
- Endpoints and Applications — Of particular entities like an IP, port, router
- ISP Peering Analytics — AS,Prefix Reports from ISP Dashboards
- Commonly Used — Popular counter groups, top hosts, apps, etc
- Direct Reports — Generate reports for any metrics , alerts, or flows
- Custom Reports — You can generate your own reports
Executive
| Report Name | Description |
|---|---|
| Consolidated IP Report | Total,in and out bandwidth traffic with top Internal hosts,top apps and port network layer protocols. |
| Executive Network | Total usage,alerts,bandwidth utilization |
| Internet Service Provider | Total bandwith,Hosts,Apps,Top ASNumber and Countries lists |
| Subscriber Activity | An overview of all your internal hosts |
| Router and Interfaces | Traffic details per router and about top router interfaces |
| Malware, botnet, virus infections | A summary of all your internal hosts that might be compromised |
| “IDS Alerts” | Summary of top IDS (Intrusion Detection System) alerts via Snort/Suricata |
| Deep drilldown of Internal Hosts | A comprehensive drilldown of internal host activity |
| Deep drilldown of External Hosts | A comprehensive drilldown of external hosts |
| Deep drilldown of Applications | A comprehensive drilldown of applications |
Endpoint and Applications
| Report Name | Description |
|---|---|
| Endpoint IP Address | Generates a summary report for a specific IP Address |
| Application | Generates a summary report for a specific port / application |
| Static IP Report | Generates Total,in and out bandwidth consume chart for a specific IP |
ISP Peering Analytics
| Report Name | Description |
|---|---|
| AS Summary Report | Generates a detailed AS Report for all Routers and Interfaces |
| AS Report per Interface | Generates a Detailed AS Report per Interface |
| Geo Country Traffic per Gateway | Country to ISP gateway mapping reports |
| Prefix Summary | Generates a detailed report for prefixes in and out of ISP network |
Commonly used Report
| Report Name | Description |
|---|---|
| Key usage report | Track usage of key activity from any counter groups. |
| Hosts | Get report of top hosts on your networ |
| Apps | Get report of top applications on your network. |
| Internal Hosts | Get report of top internal hosts on your network. |
| External Hosts | Get report of top external hosts on your network. |
| ASNumber | Get report of top ASNumber on your network. |
| country | Get report of top countries on your network. |
Netflow
| Report name | Description |
|---|---|
| Interfaces Utilization | Utilization report for selected Interfaces from Routers |
| Explore Router Interface | Flow based report for a particular Interface |
| Interface Usage Drilldown | Generates Report for traffic bandwidth and users for a particular Interface |
| Routers and Interfaces | Router and Interface activity |
Direct Reports
| Report Name | Description |
|---|---|
| Top Traffic Report | Get toppers for any counter group |
| Top Session Report | Get top flows on your network |
| Security Report | Overview of all security alerts seen by trisul alerts |
Custom Reports
| Field | Description |
|---|---|
| Report JSON | Flexible Reports in JSON Format |
| Select Time | Select the desired time |