New in Trisul 8.0
Trisul AI · AI network traffic analysis Ask your network. Get an answer you can check.
Trisul AI is a chat assistant built into WebTrisul. Ask about your NetFlow, IPFIX and sFlow traffic in plain English and get tables, charts, raw flows, dashboards and reports built from your own Trisul data, using the LLM you choose: cloud or self-hosted.
Available in NetFlow Analyzer, NSM, ISP Analytics and IPDR modes · Trisul 8.0+
The problem
One question shouldn’t take six screens
“Who ate the bandwidth at 3 PM?” is a simple question. Answering it usually means knowing which module holds the data, which counter group to open, which time window to set, and then drilling into flows by hand. Fine for a Trisul veteran. A wall for everyone else on the team. Trisul AI turns it into one plain-English question.
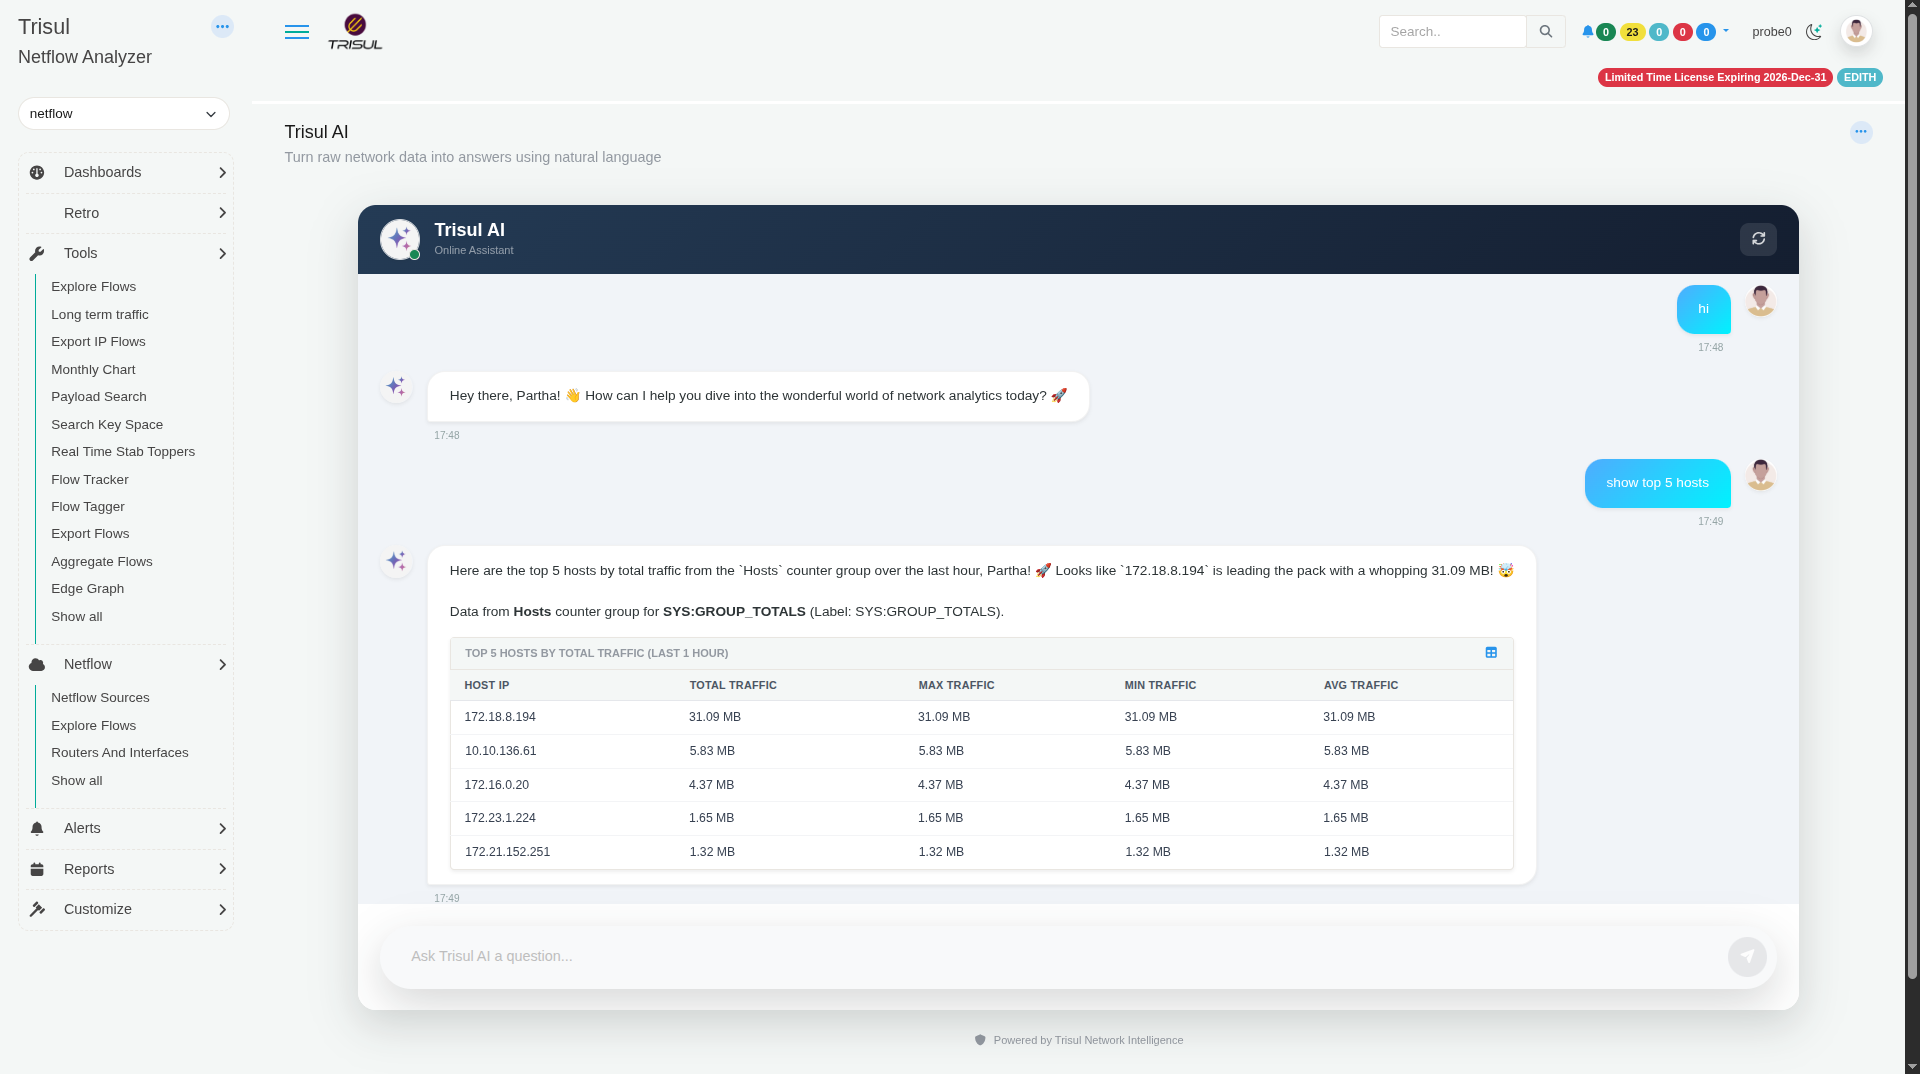
Real Trisul AI screen: one question, one table, with the counter group it used.
Why Trisul AI
An AI NetFlow analyzer built on the Trisul engine
01
Ask, don’t hunt
Plain-English questions return tables, charts, flows, dashboards and reports. A dashboard takes under a minute instead of 8–10 by hand.
02
Your data, your LLM
Use Gemini, OpenAI or Anthropic, or run any OpenAI-compatible model (Ollama, vLLM and others) on your own servers. The LLM never touches the Hub directly.
03
Same engine underneath
Every answer names the counter group it used, so you can check the number on the matching WebTrisul screen and drill down to flows.
04
Usable from day one
New team members get useful answers without learning every module first. Trisul AI also explains Trisul concepts straight from the docs.
Try asking
Natural language network queries you can run today
Pick your role. Every one of these works on your own Trisul data.
- show top 5 hostsTop-N hosts, last hour by default
- show the traffic chart of 172.18.8.194 for last 5 minutesTrend chart with zoom, pan and reset
- compare today’s top bandwidth consumers with yesterday’sPeriod comparison
- i cant see today’s traffic data in the UI can you debug what is the issueRoot cause + diagnostic summary + suggested fix
- investigate the traffic spike around 3 PMSpike investigation
- any unusual spike in inbound flows lately?Inbound flow anomalies
- show raw flows for 172.18.8.194Endpoints, protocol, bytes each way, packets from the Flow Tracker
- show top ASNsTop-N by ASN
- create a PDF report of the top 10 applications todayPDF or Excel, with a summary to review before download
- create a dashboard showing top hosts, top apps and total bandwidthReview the plan, reply “ok”, install
- compare today’s top bandwidth consumers with yesterday’sPeriod comparison
- create a keyset counter group to show IPs 192.168.10.21–25 as ChennaiGroup traffic by site, no Admin screens needed
- show top 5 hostsThe easiest first question
- what is key set counter groupAnswers from the Trisul docs
- create a dashboard for my NOC wallEngineers’ tip: start with a dashboard
- show top applicationsTop-N apps, last hour by default
How it works
How it works: your LLM plans, Trisul answers
Use a cloud LLM or a self-hosted LLM. Either way, the LLM never connects to your Hub or its database. It only sees what Trisul’s own tools return.
Step 1
WebTrisul
You ask in the Trisul AI chat. WebTrisul forwards the question.
Step 2
Trisul AI CLI
Python package, usually on the Hub. Connects WebTrisul to your LLM and runs Trisul’s tools.
Step 3
Your LLM
Gemini, OpenAI, Anthropic, or a self-hosted OpenAI-compatible model. Plans the answer.
Step 4
Your Trisul data
The CLI’s tools query the Hub over TRP: counter groups, flows and alerts.
Privacy, plainly: only the data needed to answer a question (e.g. host IPs, byte counts) goes to the LLM you configure. Use a self-hosted LLM and that data stays on your network. The LLM can’t read packet captures, and no telemetry is sent to Unleash Networks.
Dashboard in a sentence
Build a network dashboard from one sentence
Describe it, review the plan, reply “ok.” Trisul AI lays out the modules on a 12-column grid, waits for your approval, then lets you preview, install or download the JSON for another Trisul instance. Missing a metric? It proposes the counter group to collect it.
By hand
8–10 min
Pick modules, set widths, wire counter groups
With Trisul AI
< 1 min
One sentence, one review, one “ok”
Setup
Set up Trisul AI in 3 steps
2
Run the Trisul AI CLI
Docker is the quickest way: one container, usually on the Hub. Docker guide
docker run -d --name trisul-ai-cli \
  -p 8200:8200 \
  -v trisul-ai-config:/var/lib/trisul-ai \
  parthasarathy369/trisul-ai-cli:latest
Prefer pip? Python 3.10+: pip install trisul_ai_cli, then trisul_ai_cli api. pip guide
3
Connect WebTrisul
Go to Webadmin → Manage → App Settings → Trisul AI. Set the AI endpoint IP and port (default 8200), then choose your LLM and add its API key. Open Trisul AI from the sidebar. Full setup guide
FAQ
AI network traffic analysis FAQ
What is AI network traffic analysis?
It means asking questions about your network traffic in plain English and getting answers built from real flow and packet data. In Trisul AI, an LLM plans the answer and Trisul’s own tools fetch the numbers from the data Trisul already collects, so every chart or table can be checked against the matching WebTrisul screen.
Which LLMs does Trisul AI support?
Hosted: Google Gemini, OpenAI and Anthropic. Self-hosted: any OpenAI-compatible endpoint, such as Ollama, LM Studio, vLLM or LocalAI.
Can I run Trisul AI with a local LLM like Ollama?
Yes. Point Trisul AI at any OpenAI-compatible endpoint (the custom:local option), such as Ollama, LM Studio, vLLM or LocalAI. Your traffic data then stays on your network. [VERIFY: recommended model and hardware size]
What data does the LLM see?
Only what’s needed to answer your question, such as host IPs and byte counts, returned by Trisul’s own tools. The LLM has no direct connection to the Hub or its database and can’t read packet captures. With a self-hosted LLM, that data stays on your network.
Can Trisul AI change my configuration?
Only after you approve. Requests that create dashboards or counter groups show a plan first and wait for you to reply “ok.” It suggests diagnostic commands but never runs them on your servers.
What can't it do?
- Read PCAPs
- Run commands on your servers
- Report on data Trisul doesn’t collect (it tells you, and may propose a counter group)
- Schedule reports (use Admin → Schedule Email Reports)
- Work if the CLI machine can’t reach your LLM
What do I need?
Trisul 8.0 or later in NetFlow Analyzer, NSM, ISP Analytics or IPDR mode, plus Docker (or Python 3.10+) for the Trisul AI CLI, and access to an LLM.
Does Trisul AI work with NetFlow, IPFIX and sFlow?
Yes. Trisul AI answers from whatever Trisul already collects: NetFlow, IPFIX and sFlow in NetFlow Analyzer mode, plus metrics computed from packets in NSM mode. It can’t read PCAP files themselves.
Is Trisul AI included in my license and the free trial?
[VERIFY: licensing tiers and 7-day trial coverage]
Can it run fully offline or air-gapped?
A self-hosted LLM keeps your traffic data on your network. [VERIFY: whether doc search embeddings can run without a cloud API]
Is Trisul AI the same as IPDR AI?
No. IPDR AI is a separate feature of the Trisul IPDR compliance product for ISP and telecom teams, with its own setup.
Ask your first question today
Start a free trial, see it live, or upgrade from 7.0.