6.7. Retro analysis tools
You have selected a time interval you want to focus on – whats next ? Now you need to select an analysis tool to apply to the time interval.
You have to pick one of the following tools shown just below the time selector.
| Name of tool | Why you want to use this tool |
|---|---|
| Commonly used retro analysis | All your retro dashboards show up here. Each dashboard features multiple modules showing results of retro analysis. Examples are : Layer 2 Activity, Hosts and Applications, etc |
| Investigate activity of a specific IP | Investigate complete activity of a host in selected interval. Details include conversations, flows, security alerts, malware activity, peer connections, upload / download data etc |
| Counter Group toppers | Who were the toppers in a counter group for a statistic ? Also shows topper trends in time interval with ability to do a cross drill on any of them |
| Show traffic chart for an item | Draw charts for any item such as a host, app, subnet |
| Security Alerts retro | Various views of alert activity seen in selected interval |
| Investigate users of an application | Investigate complete activity of an application. Who the top users are of that application and other details split up by upload / download |
| Flow trackers | View top flows in the timeframe based on various criteria |
| Pull packets | Get raw packets in tcpdump/libpcap format matching a certain key |
| Long term traffic charts | Used to see daily trends in traffic. Arranges traffic by day on top of each other so you can observe busy hours etc |
6.7.1 Commonly used retro analysis
Select a retro dashboard to apply to the time interval.
Some of the built in retro dashboards are :
| Host and applications | Top Hosts and applications shown in list, pie chart, and long term trend charts. |
| Link Layer activity | Top Link Layer protocols (IPv4/IPv6/MPLS/ARP/BOOTP) + Top MAC addresses + Top MAC-Pairs (links) presented in a lists and charts |
| Protocols and Hosts | Top IP protocols (TCP/UDP/ICMP/GRE/OSPF etc) + Top hosts. Views include lists, pie charts, and usage history stacked area charts |
| Hosts and Subnets | Top Hosts and IPv4 Subnets in selected time interval |
| Netflow Sources | Top Routers and Router Interfaces exporting netflow data to Trisul. Use this to tool to judge what is your netflow data rate. Netflow Only |
| In Out Transit | Traffic from a inside/outside perspective. # Traffic In vs Out of your network. # Internal Traffic (src & dest in your network) # Transit Traffic (src & dest outside your network) |
| Top Application Trends | View top applications over long time periods in a stacked bar chart format. Very useful to get profile of apps into vs out of network |
| Ethernet activity | L2 Broadcast vs Multicast vs Unicast chart. ICMP and ARP floods. L2 Protocol trend charts |
| IDS alerts | Bubble chart showing IDS alert profile over selected time interval |
6.7.2 Investigate activity of a specific IP
Enter an IP address or a host name to view detailed activity of that host.
The analysis includes
- Activity charts including peers, upload, download
- Top applications for this host
- Conversations with other hosts
- Security attacks targeted at host
- Blacklisted activity (malware/botnet) if any
- Individual flows
Trisul will then run the Investigate IP analysis tool for the selected items and time interval.
6.7.3 Counter Group toppers
View the toppers for a counter group and meter.
For example : You can select counter group Hosts and meter Connections to view hosts with most connections in the selected interval.
The information is presented in lists, charts, and a trend chart.
6.7.4 Show traffic chart for an item
View usage charts for a particular item for selected time interval.
For example : You can just type smtp in the box and view all statistics for the requested application in charts and tables. You can then save them as PDF if you wish.
6.7.5 Security Alerts retro
Slice and dice IDS events from different angles in selected time interval.
The available selections in the drop down list View IDS Alerts By are :
| Alert types | Show aggregated alerts grouped by signature |
| Top attackers | Top source IPs which originated the alerts |
| Top victims | Top destinations IPs |
| By Priority | Alerts grouped by priority |
| By Classificiation | Alerts grouped by classification |
| All alerts | Individual alerts received |
6.7.6 Investigate users of an application
Complete break up of behavior of an application.
The analysis includes
- IP conversation matrix for this app
- Tops IPs transmitting and receiving app
- Peers
- Top individual flows involving this app
The analysis will take you to the Explore tool with the selected items and time interval.
6.7.7 Flow trackers
Flow trackers are used to monitor and store top flows matching specific criteria.
Some of the built in trackers are :
| Traffic | Flows with maximum volume transferred (both directions together) |
| Long lived | Flows which stayed alive for longest time |
| Transferred Out | Flows which transferred maximum data out of your Home Network (Uploading) |
| Transferred In | Flows which transferred maximum data into your Home Network (Downloading) |
| Local Traffic | Top flows internal to your Home network |
| Suspicious | Flows that fired a blacklist based even, either by IP, requesting a domain name, or by requesting a URL |
| FilterFailed | Flows that don’t use any of the well known ports |
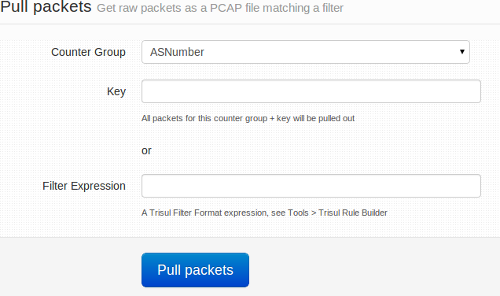
6.7.8 Pull Packets
Pull up a sample of raw packets for the selected time interval and additional criteria.
NOTE There are some caps on this feature to prevent accidental misuse.
- By default only 5MB of raw data is retrieved
- By default only 1800s (30minutes) of interval can be analyzed
If you wish to change these settings, go to App Settings and change the Deep Packet Inspection Limit and Deep Packet Inspection Content Limit. Please be aware that in busy network analyzing packets can take time to complete.
Using the tool
You have two ways to use this tool to pull up raw packets.
-
Packets for an item → Select a counter group and key.
- Counter group =
Countryand key =JAwill get packets from Japan. - Counter group =
Appsand key =smtpwill get email packets.
- Counter group =
-
Packets matching expression → Trisul Filter Format is a flexible way of constructing filters. You can enter an expression to run more sophisticated packet queries.
- Enter the string
{C51B48D4-7876-479E-B0D9-BD9EFF03CE2E}=p-0050,p-0051,p-0052,p-0053to retrieve packets for ports 80,81,82, and 83.
- Enter the string
Upon running the tool, your browser will automatically download a PCAP file containing the requested packets.
6.7.9 Long term traffic charts
Draw long term charts designed to aid time of day based comparisons.
You have to select an item and a set of stats to chart for that item. The result will be a chart showing most recent 7 days of data arranged by day.
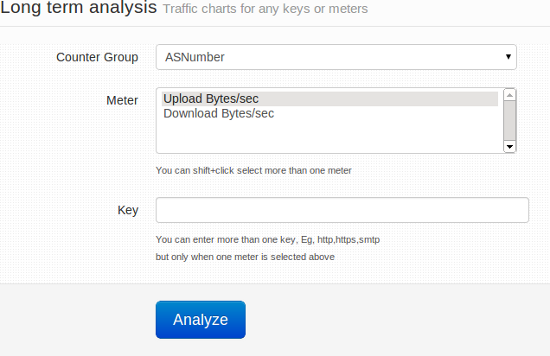
This tool will take you to the Long term traffic trends tool with the start time and other selections automatically filled in.