
This is an old revision of the document!
Table of Contents
Analyzing the WRCCDC PCAPs : Part 3 Analysis using TrisulNSM
In this article we will just show pictures and a video of how you might analyze the imported PCAP dumps using Trisul.
This is Part-3 of a 3 Part series
- Part 3: Screenshots & video of analysis paths (using TrisulNSM)
Time to show and tell.
Video showing UI navigations
Trisul has a ton of features and it can be a bit daunting at first where to start, where to go next and so fortm. A sample video made by one of our engineers showing the various places where you can start and gives you a feel for the capabilities. There is a music soundtrack but no narration
Monitoring Techniques
Here are a few screenshots of the dataset showing the monitoring and baseline building techniques described in Part-1 of this series
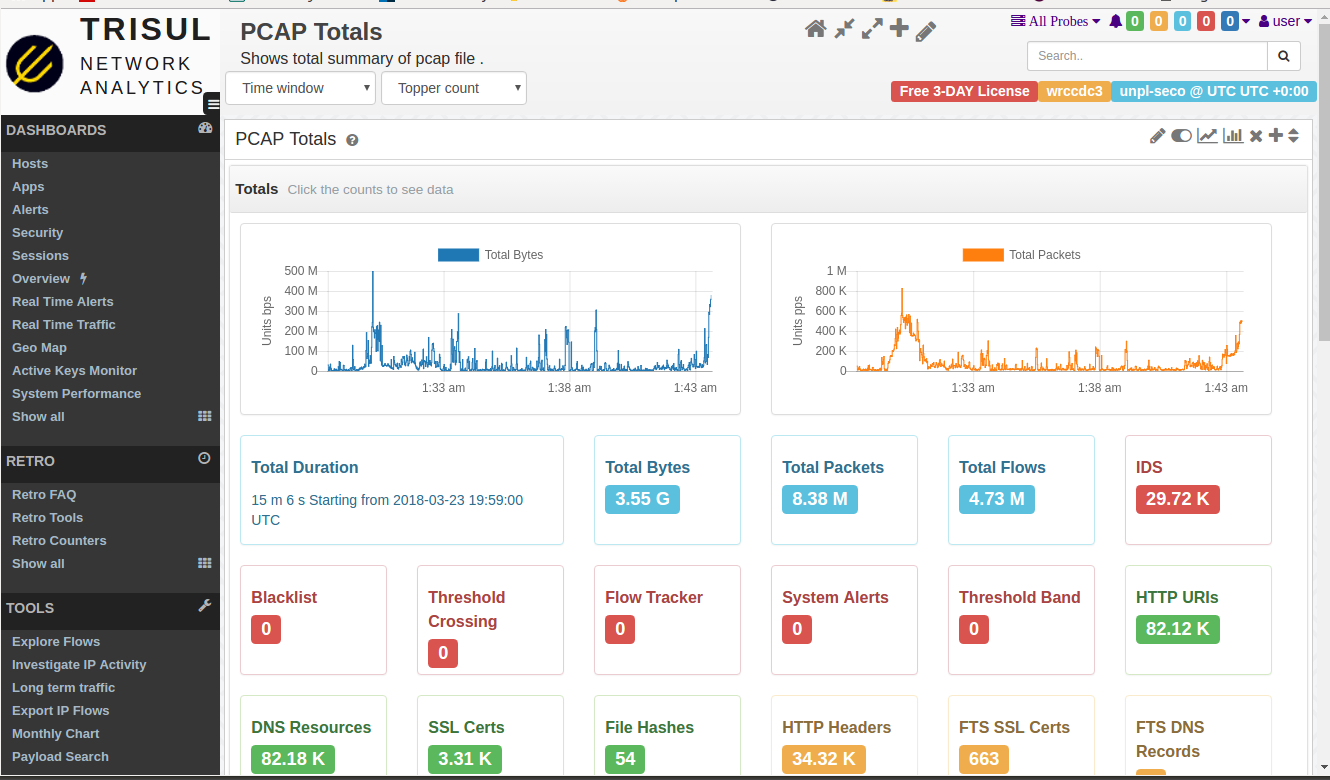
Start from PCAP Summary Dashboard
Open with Dashboards > Show All > scroll down to the bottom and locate PCAP Summary
The best place to start is the PCAP summary. Wireshark users can think of it as a supercharged capinfos. It shows you bandwidth usage chart in bytes, packets, total time, number of flows, number of various types of metadata extracted, alerts, etc. You can click on any item to follow an analysis path from there.
Hosts Dashboard
Open with Dashboards > Hosts
The Hosts dashboard is a good top level dashboard to give you a baseline view of host activity. See which internal and external are most active. By volume, by connections, etc. You can click the small button next to each item to drilldown from that. But right now we're just baseline building. You can check out the Apps dashboard for a similar view of Application activity.

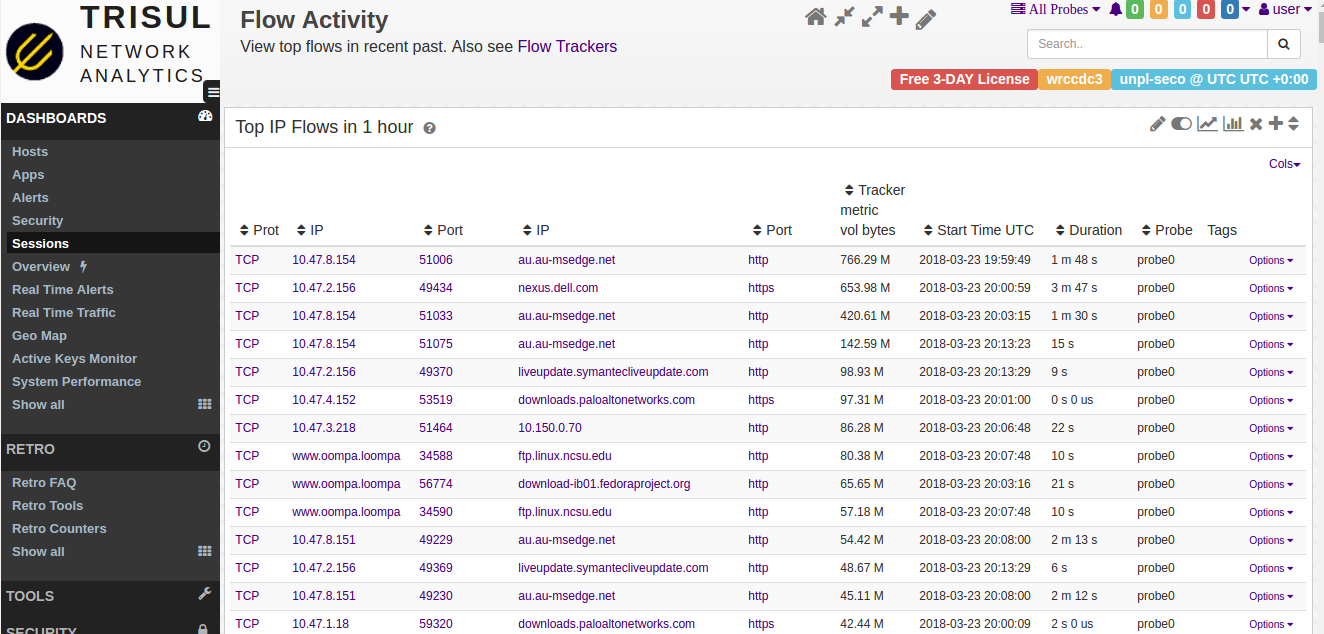
Get an overview of flow activity
Open with Dashboards > Sessions
This is a favorite starting point. You can see the PCAP dump from a flow perspective, you immediately get insight into what actual traffic is flowing. In this case , you can immediately see more than 30% of the traffic in the PCAP is from 10-15 flows. There is a lot of windowsupdate, symantec updates, etc. That is useful baseline information to have. You can also get flows uploading data OUT of your network, downloads, long running flows but low volume, etc.
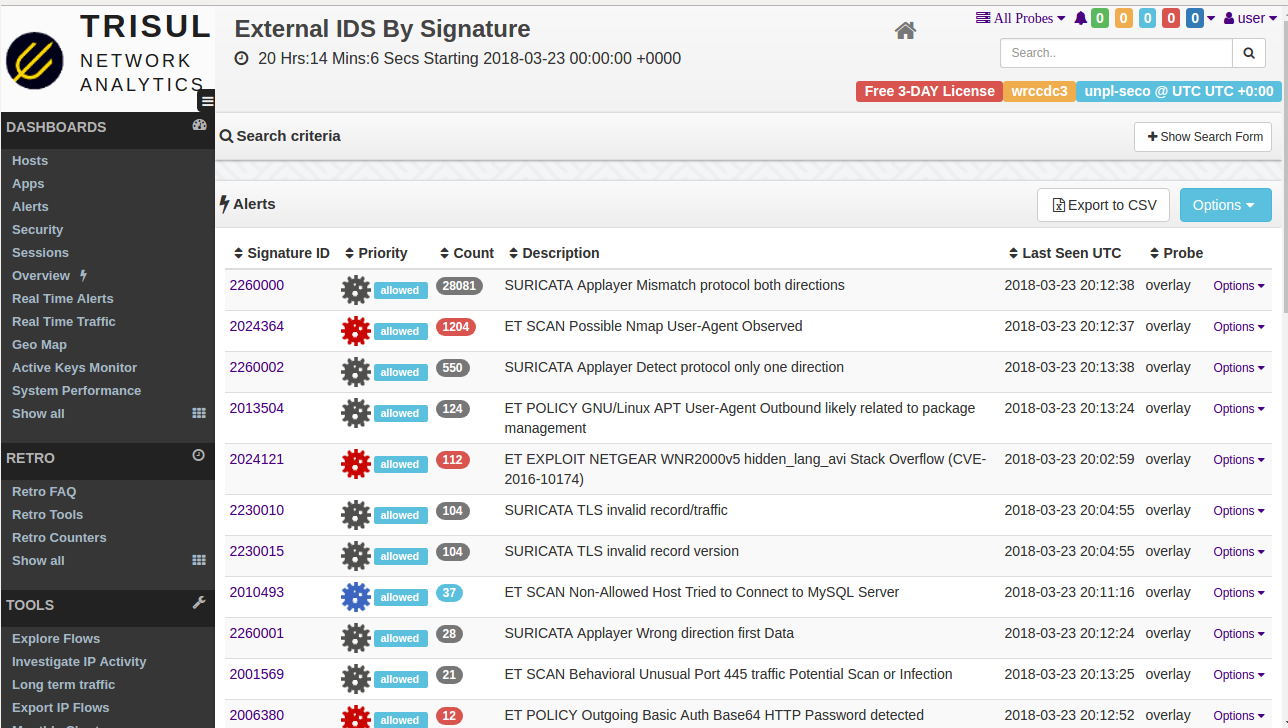
Viewing IDS Alerts
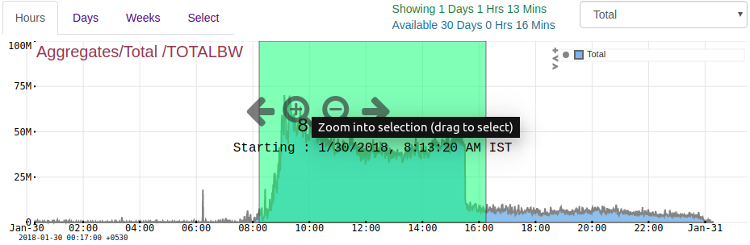
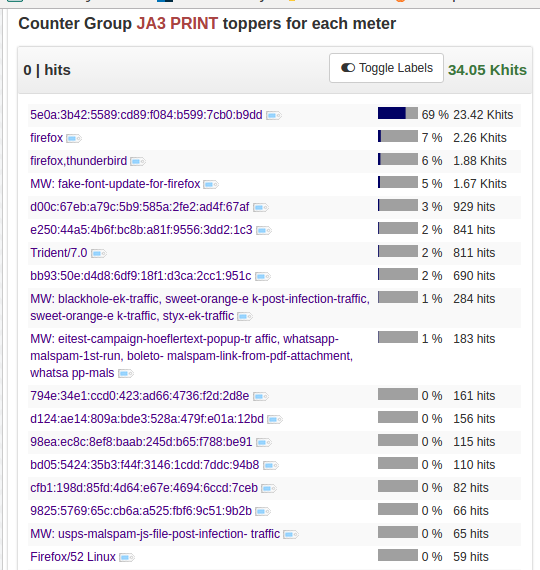
Retro Analysis - view advanced counters
Here we are seeing the JA3 TLS Fingerprints
Drilldown techniques
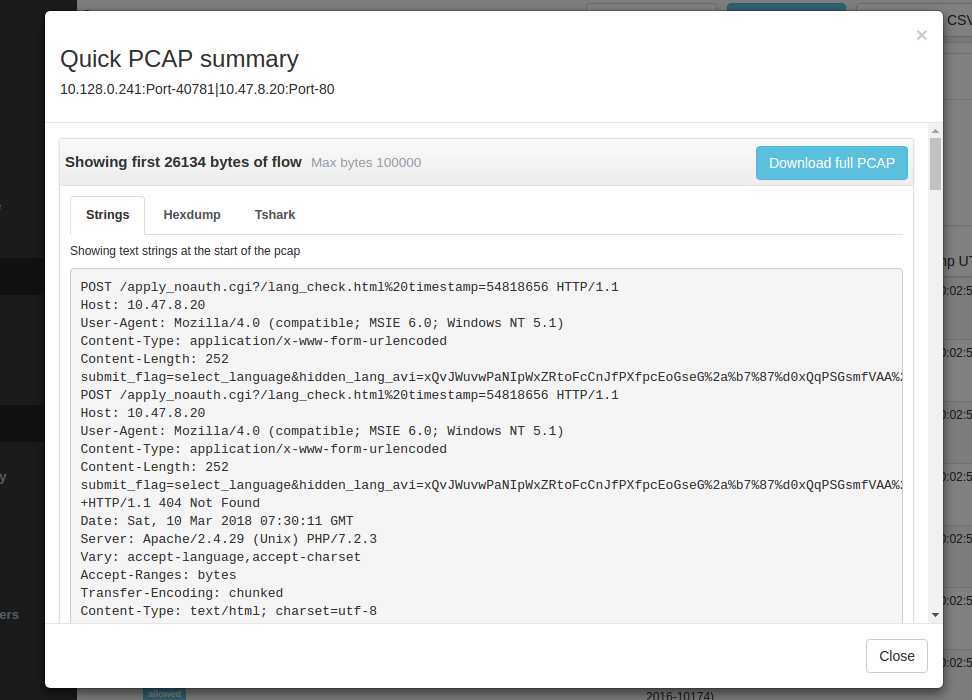
Explore flows

Trisul EDGE: Graph analytics discover relationships

File Extraction
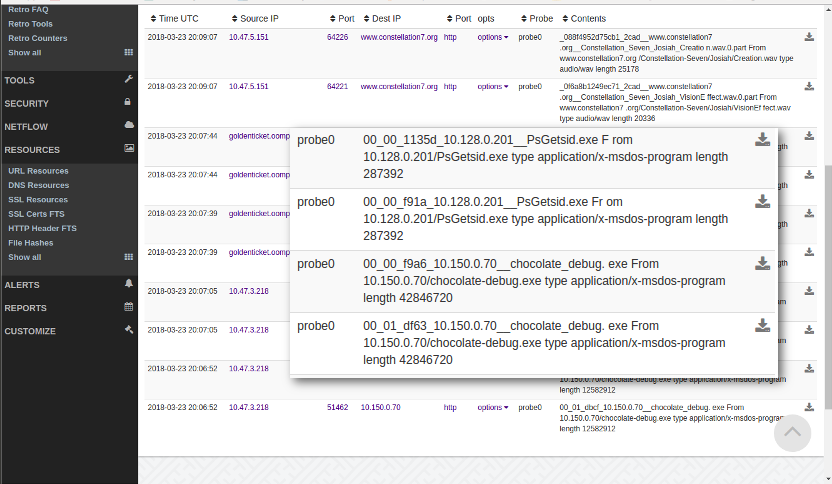
Drilldown to Packets
File extraction
DOCKER:unpl:root savedfiles$ ls /tmp/savedfiles/*.exe -l
-rw-r--r-- 1 trisul trisul   287392 May 11 12:52 /tmp/savedfiles/00_00_f91a_10.128.0.201__PsGetsid.exe
-rw-r--r-- 1 trisul trisul   287392 May 11 12:52 /tmp/savedfiles/00_00_fb80_10.128.0.201__PsGetsid.exe
-rw-r--r-- 1 trisul trisul 12582912 May 11 12:52 /tmp/savedfiles/00_01_dbcf_10.150.0.70__chocolate_debug.exe
-rw-r--r-- 1 trisul trisul 42846720 May 11 12:52 /tmp/savedfiles/00_01_df63_10.150.0.70__chocolate_debug.exe
DOCKER:unpl:root savedfiles$