Table of Contents
Processing the DEFCON 26 CTF PCAPS using Trisul NSM
With the right tools, analyzing large PCAP dumps can be lots of fun. This article is a step-by-step of using TrisulNSM to dive into the DEFCON26 CTF PCAP 1)
Given only a large PCAP dump, your first task as an analyst is to make sense of it from multiple angles. I typically like to start off with a statistical overview.
- What is the timeframe of the CTF?
- What was the bandwidth used over the time duration ?
- What were the top IPs as attackers and as targets?
- What ports were targeted?
- Any red flags from IDS like Snort/Suricata over the duration?
- Top flows download/upload
- then once you have a baseline, You can follow several tracks to investigate in depth. Down to the packet level.
TrisulNSM (Trisul Network Analytics) is the leading platform today for performing this kind of analysis over very large PCAP files. This article describes how you can use our free docker image trisulnsm/trisul6 to slurp this PCAP and then have some fun analyzing it. The docker image runs a 2-pass analysis with TrisulNSM and then with Suricata and then presents a unified analysis.
Get started
So,lets get started. We assume you have a fairly decent Linux machine ready with Docker installed. Any distro will do because we are going to be using our Docker image.
- Download the DEFCON26 PCAP , a 5GB file into a directory.
- Unrar the file and extract the inside PCAP into a filename without spaces such as
dc26ctf.pcap - Create a directory on your system where the results will be stored. Move the PCAP to that directory so the docker container can see the PCAP file.
mkdir /opt/trisulroot
mv dc26ctf.pcap /opt/trisulroot
Run the trisulnsm/trisul6 docker image over the PCAP and run the webserver over port 4000.
 sudo docker run  --privileged=true  \
     --name=trisul1a    \
      --net=host -v /opt/trisulroot:/trisulroot   \
        -d trisulnsm/trisul6 \
         --pcap dc26ctf.pcap \
           --webserver-port 4000
You can check the docker logs if the process kicked off successfully.
docker logs trisul1a -f
If there are no errors here, it means the process has been kicked off. Expect anywhere from 20 minutes to an hour depending on your computer's CPU/Memory/SSD configuration 2).
To monitor the progress login to the container and do the following.
root@unpl:~# docker exec -it trisul1a /bin/bash
docker$  # to view process usage
docker$  top

docker$  # add helper macros for trisul
docker$  source /usr/local/share/trisul-probe/trisbashrc dc26ctf1

docker$  # tail the log files
docker$  tailf.ns
You might want to take a break and have a coffee !! When you get back you can login to http://ip:4000 to analyze the fun stuff.
Screenshots
After the processing is complete. You can view the results from the web interface. Here are some sample leads.
Retro Counters
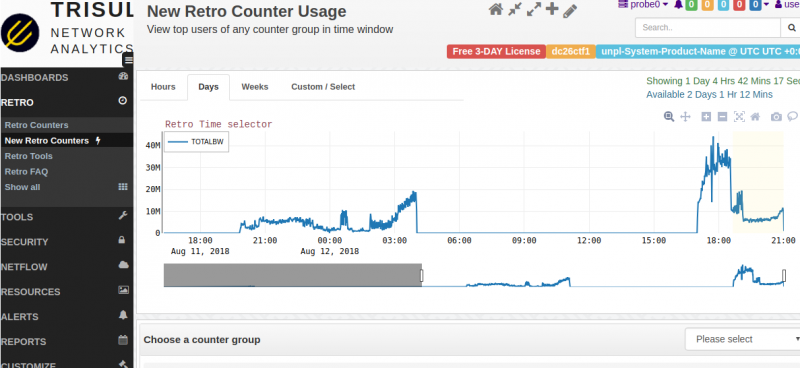
Click on Retro > Retro Counters to view a Timeline showing traffic bandwidth. Here we see between 10 and 100Mbps spanning a 3-day period of the competition. From here you can select any timewindow and drill down into Counters.
Trend
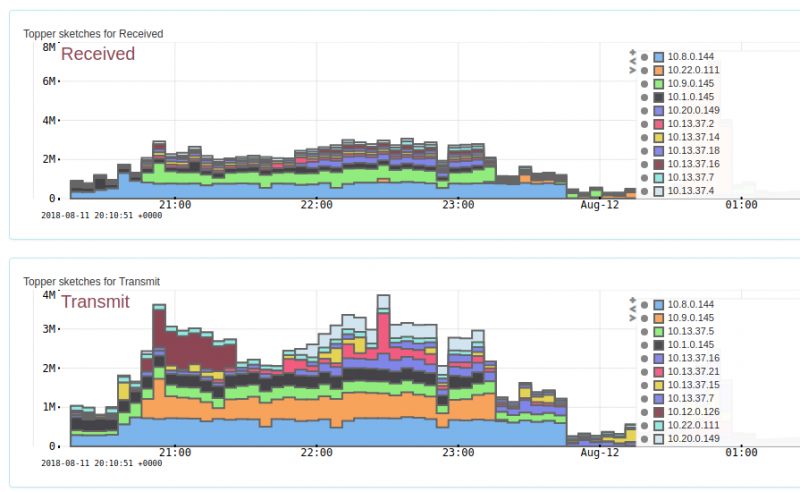
Clicking the Topper Trends tab in Retro counters gives you a timeseries view of top activity of hosts, apps, VLANs.
Top flows
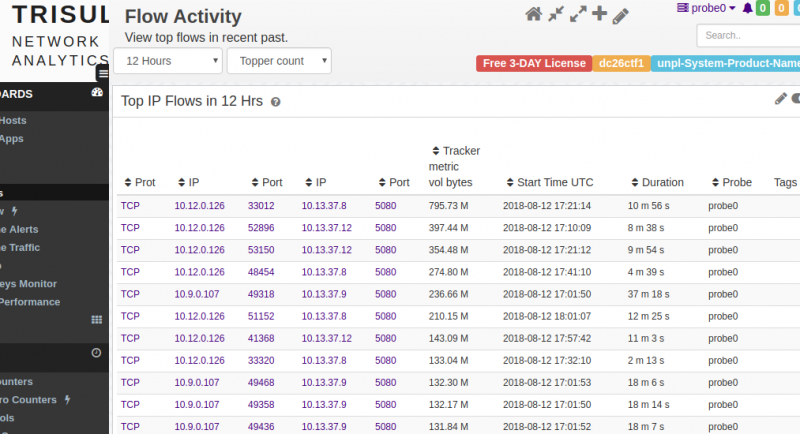
Click on Dashboards > Sessions to see top flows by volume, long lived flows, download, upload. This is a really good place to start because in many CTF or even enterprise loads - elephant flows 3) dominate the overall volume of data. Here we see a single flow from IP 10.13.37.8 pushing nearly 800MB in a 10 Min transfer.
PCAP totals dashboard
Open Dashboards > Show All > PCAP Totals
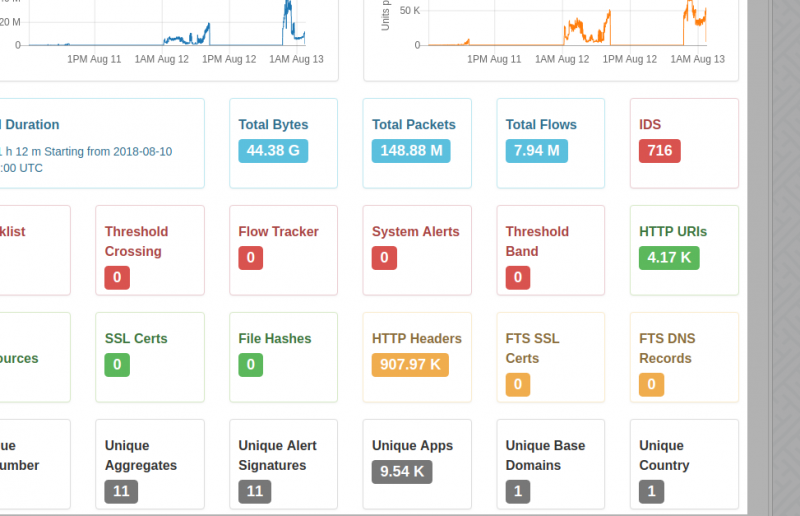
The PCAP Totals dashboard is an excellent place to start off your analysis. On a single dashboard you can see the traffic details, number of unique host, apps, VLANS, TLS Certificates, IDS Alerts, HTTP URLS, SNI, JA3 TLS Fingerprints, and over 40 other types of metrics. You can then click on them to drill down further.
Edge Graph Analytics
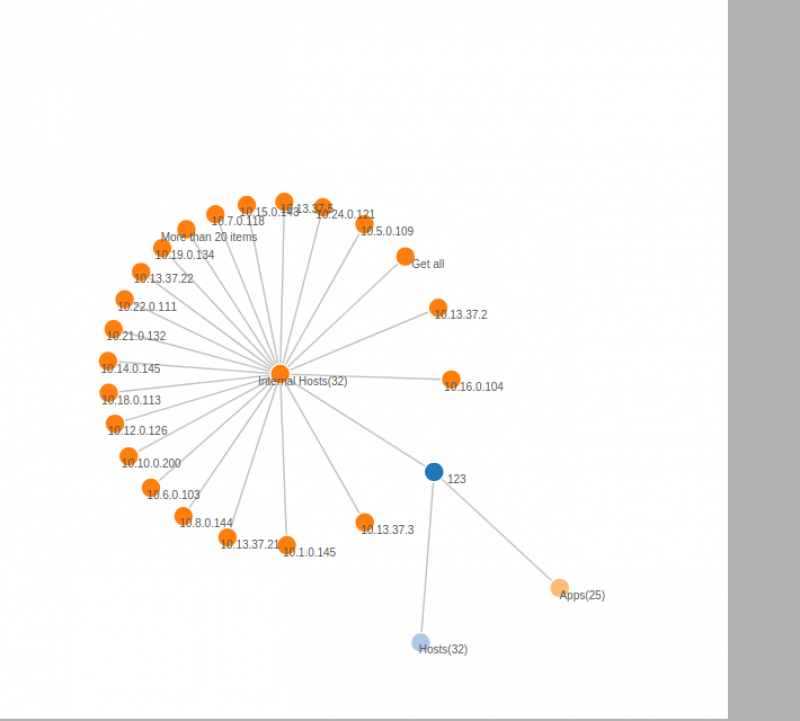
You can click on the small blue button next to any table item and open “Edge Graph” to reveal neighboring items. Here we went from PCAP Totals > Click on HTTP Status > Then on the weird looking “Status 123”
Exploring HTTP Status 123
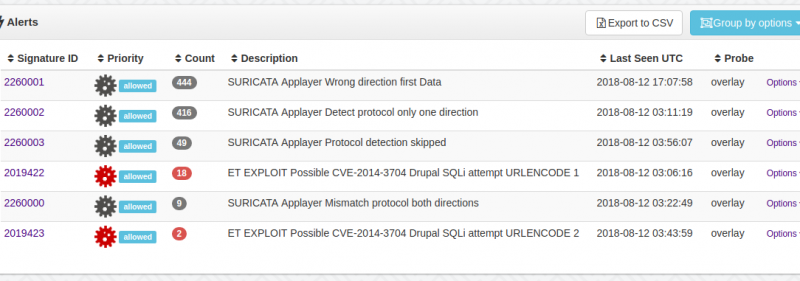
IDS Alerts, attacks on Drupal
Select Alerts > Show All > IDS to show the IDS alert categories seen. You can then click on an alert to drill down further or pull up PCAPs.
Pivot to packets from anywhere
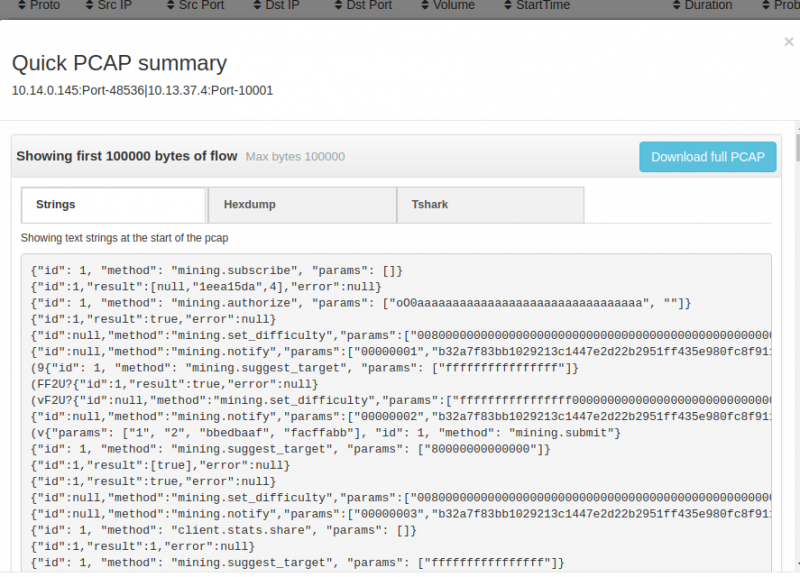
Trisul lets you seamlessly pivot from any analysis point to PCAPs. You can pull down entire PCAP or use the super nifty “PCAP Headers” to only see the top of the PCAP. In the PCAP headers, we show the 'strings' seen in the PCAP header, the actual Hexdump, and a TSHARK like packet summary.
Conversations of a particular hosts
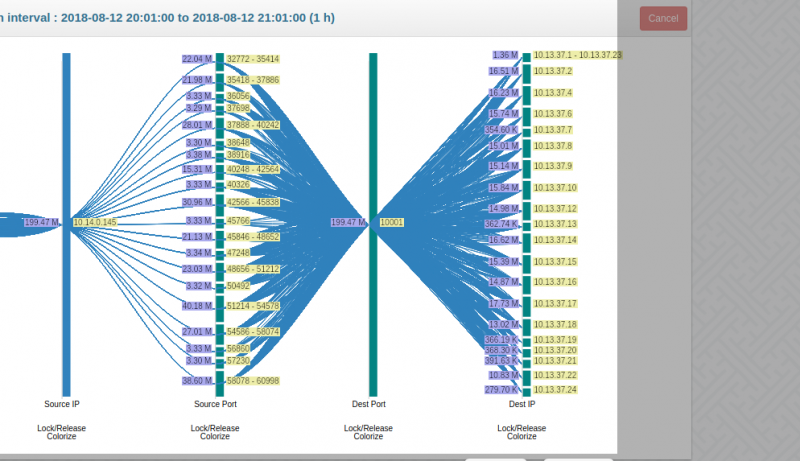
Click on Dashboards > Hosts > Then on any host and “Explore Flows” to bring up the Flow explorer. In TrisulNSM, every flow is stored for instant recall. You can also select Tools > Explore Flows > Then enter a query expression in the box to retrieve flows.
Port connections over time
The last one here is quite interesting. Go to Retro Counters > Select the entire Time interval and then select “Apps”. We find that CTF contestants attacking different ports on different days. Hmm, maybe something to look deeper into.
Conclusion
Hope network analysis enthusiasts find this useful. The docker image bundles a Free License of Trisul. PCAP dumps upto 3 days in time can be imported.
You can also install TrisulNSM natively on your Ubuntu or CentOS and then import the PCAPs there. The Docker image however makes it really easy.

