AI Powered Dashboard building with Trisul 8.0. AI you can use today.
Trisul Network Analytics places hundreds of network traffic performance metrics at your fingertips with the possibility of adding hundreds of more custom metrics. Naturally such a rich KPI base can enable you to create any type of visualization whether real time or historical, or any of the dozens of types of charts.
By connecting a LLM even a local LLM like Qwen or Gemma running on a MAC – you can trivially build any type of dashboard by just saying what you want. We have packed a RAG Vector Database with much of the information and documentation about every metric and applicability.
For example:
Hey I want to see Google and Facebook ASN Traffic across my entire network.
Is all you need. The model throws up a plethora of options you can fine tune. It knows the counter groups , the filtered counters, the peering interfaces that carry Google, the caches, and so on.
Building a Trisul dashboard the old way meant a fair bit of manual work. Knowing which module has the data you need, or building one from scratch if it didn’t exist yet. Knowing which countergroup inside it actually holds what you’re after. What chart type suits the data, a pie chart for distribution, a line for trends, and so on. None of it was hard, just tedious.
And if you wanted something fancier, like a three dimensional breakdown or a custom time window, you ended up doing configuration work that wasn’t really your job to begin with.
We’ve written about Trisul AI before, but this time it’s genuinely evolved into something that makes the old workflow feel like a relic. So let’s talk about it, and this time we’ve got actual receipts.
The Old Way Made You Do the Homework
Here’s the deal with the manual route. You were the one holding all the knowledge. Which countergroup lives where, what width looks decent, whether a bar chart or a heatmap tells the story better. All of it lived in your head before you even started building. And if you wanted multi dimensional data, crosskeys entered the picture, and suddenly you were creating new modules just to see hosts, countries, and apps in one place.
It worked just fine. It just took a while to get there.
Now You Just Say What You Want
With Trisul AI, you skip the homework entirely. Here’s what that actually looks like, straight from a real session with the assistant.
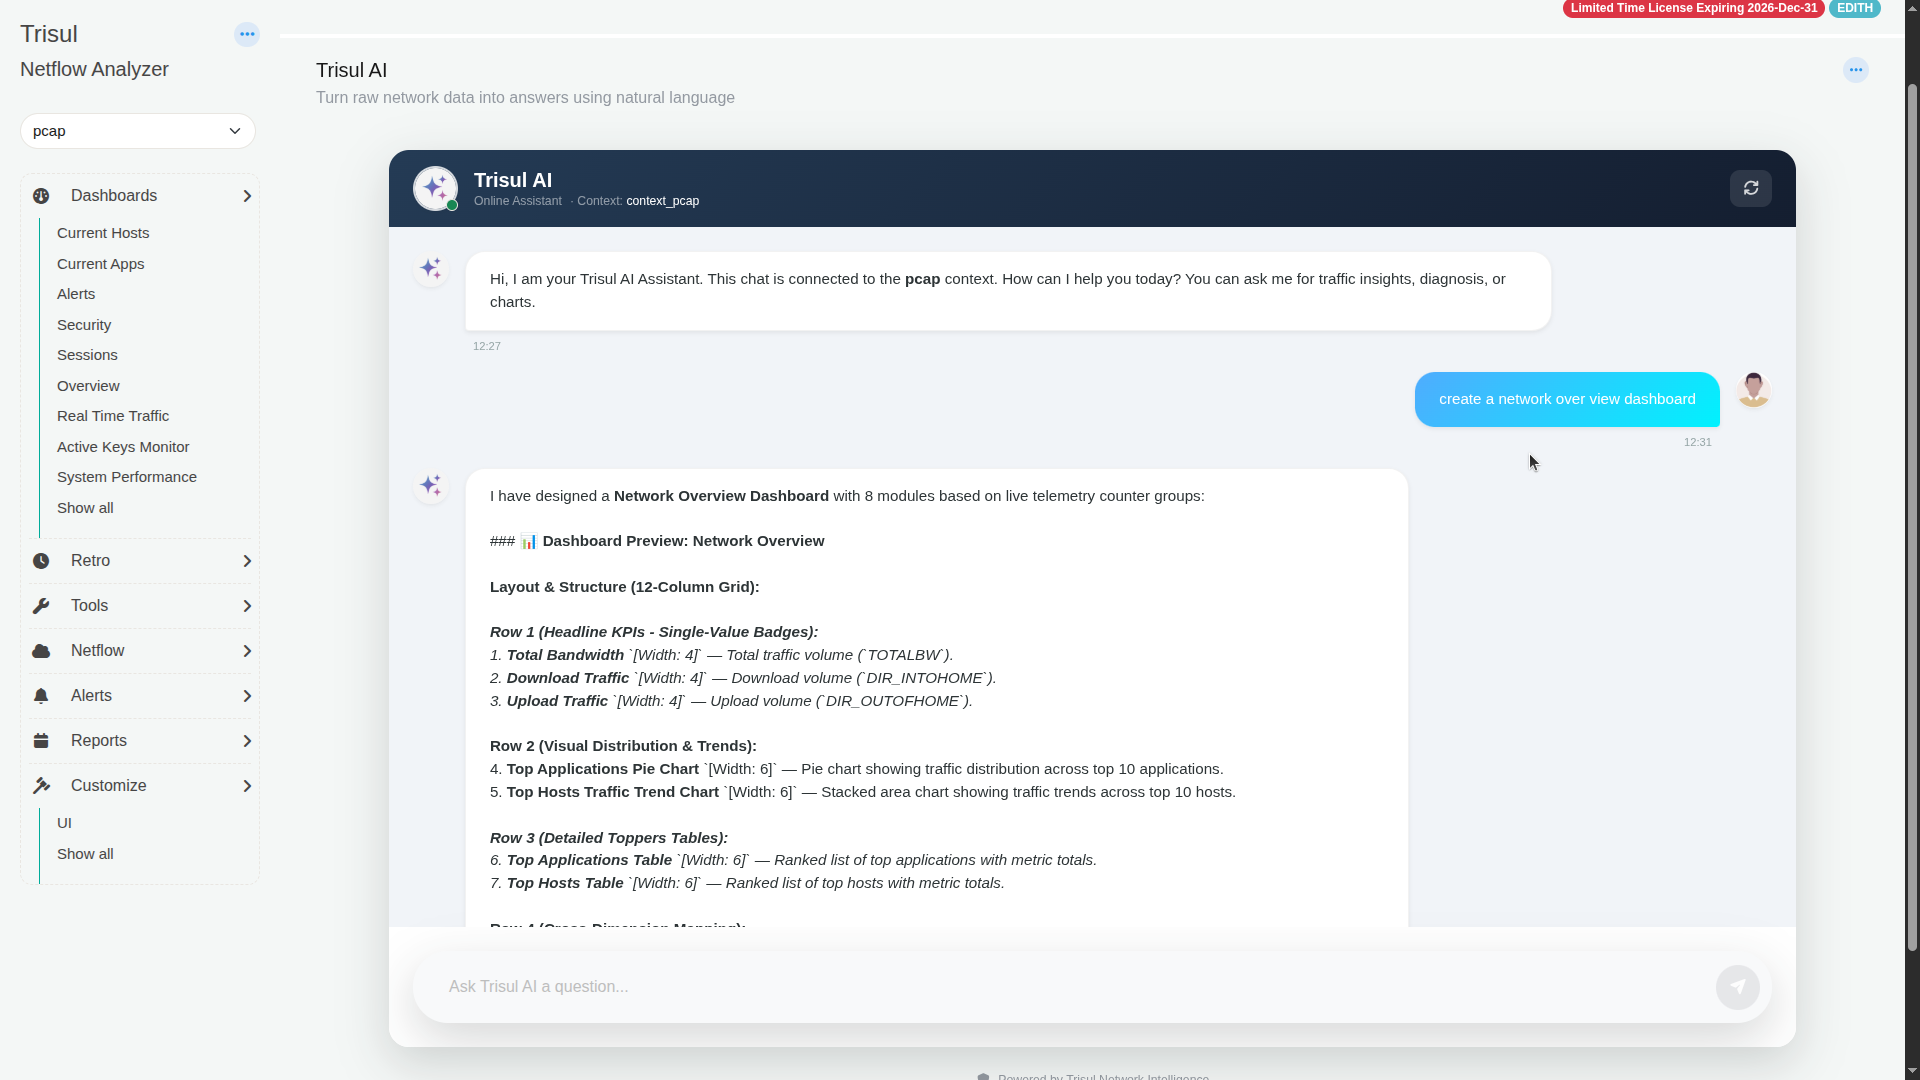
Someone typed exactly this into the chat: “create a network over view dashboard.” That’s it. No countergroup names, no module lookups, nothing.
Trisul AI came back with a full plan. It named eight modules, laid them out across a twelve column grid, and explained exactly what each one would show. Total Bandwidth and Download and Upload Traffic as headline KPI badges, a Top Applications Pie Chart and a Top Hosts Traffic Trend Chart for the visual layer, ranked tables for both applications and hosts, and a Hosts to Apps Sankey diagram to map who’s talking to what.
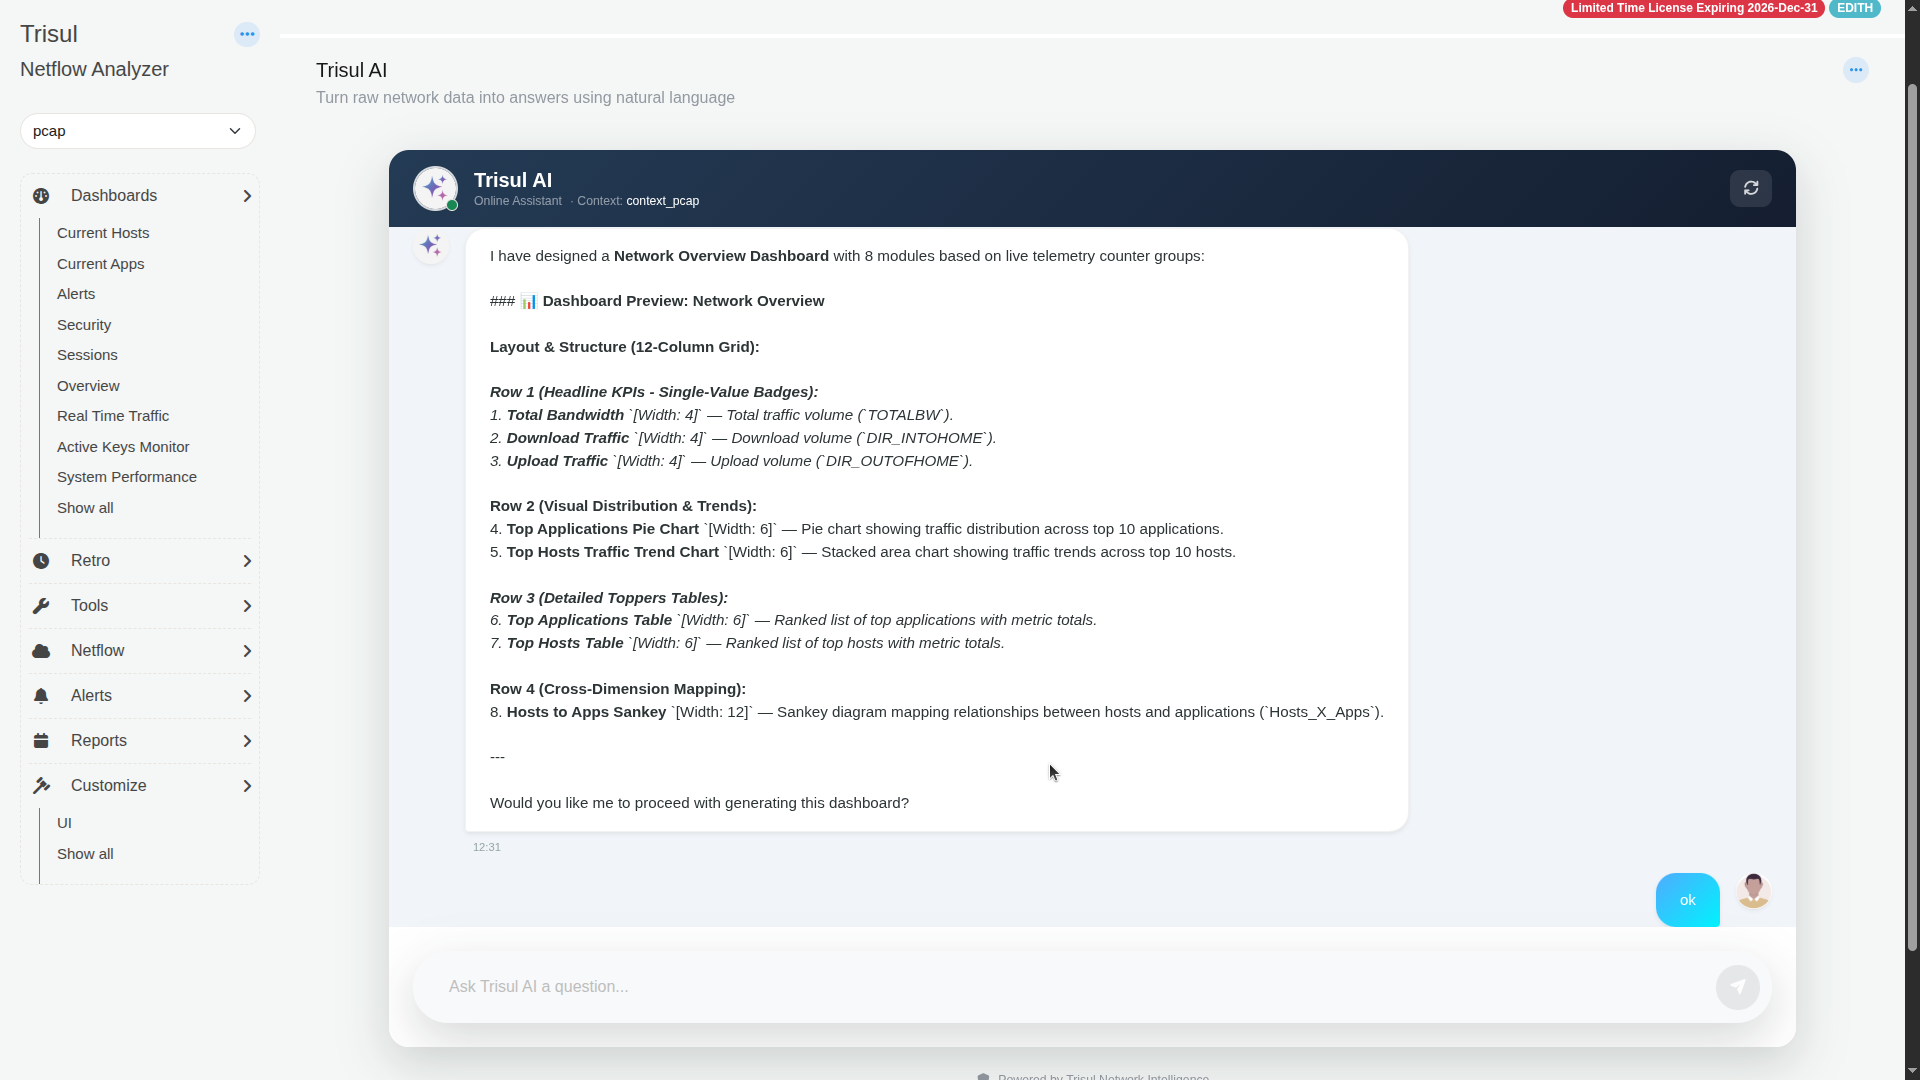
And then it stopped and asked, plain as day, “Would you like me to proceed with generating this dashboard?”
This is the part that matters. It didn’t just build something and hope for the best. It showed its full plan first and waited for a green light.
The Three Options, In Action
Someone replied with a simple “ok.”
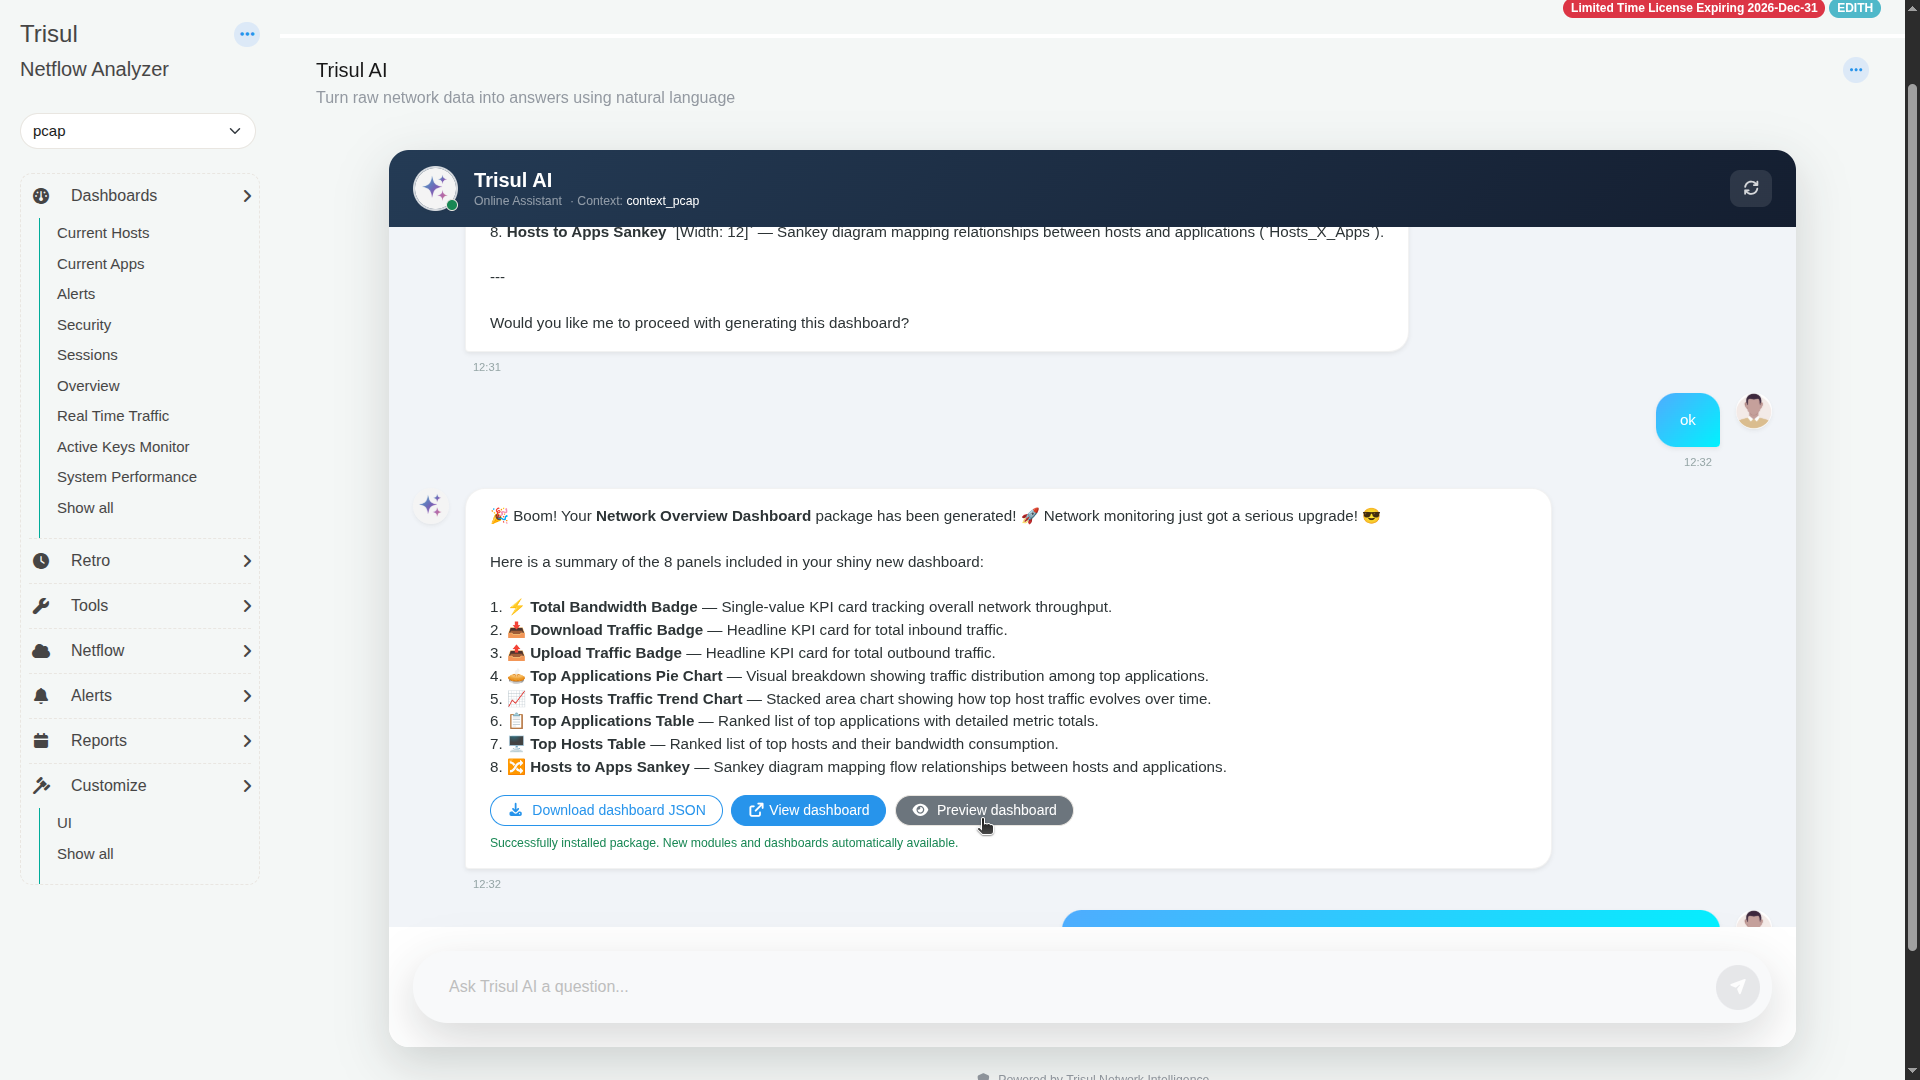
And Trisul AI delivered. “Boom! Your Network Overview Dashboard package has been generated,” followed by a clean summary of all eight panels, and then the three buttons we talked about last time, now actually visible in the wild: Download dashboard JSON, View dashboard, and Preview dashboard. Underneath, a quiet little confirmation: “Successfully installed package. New modules and dashboards automatically available.”
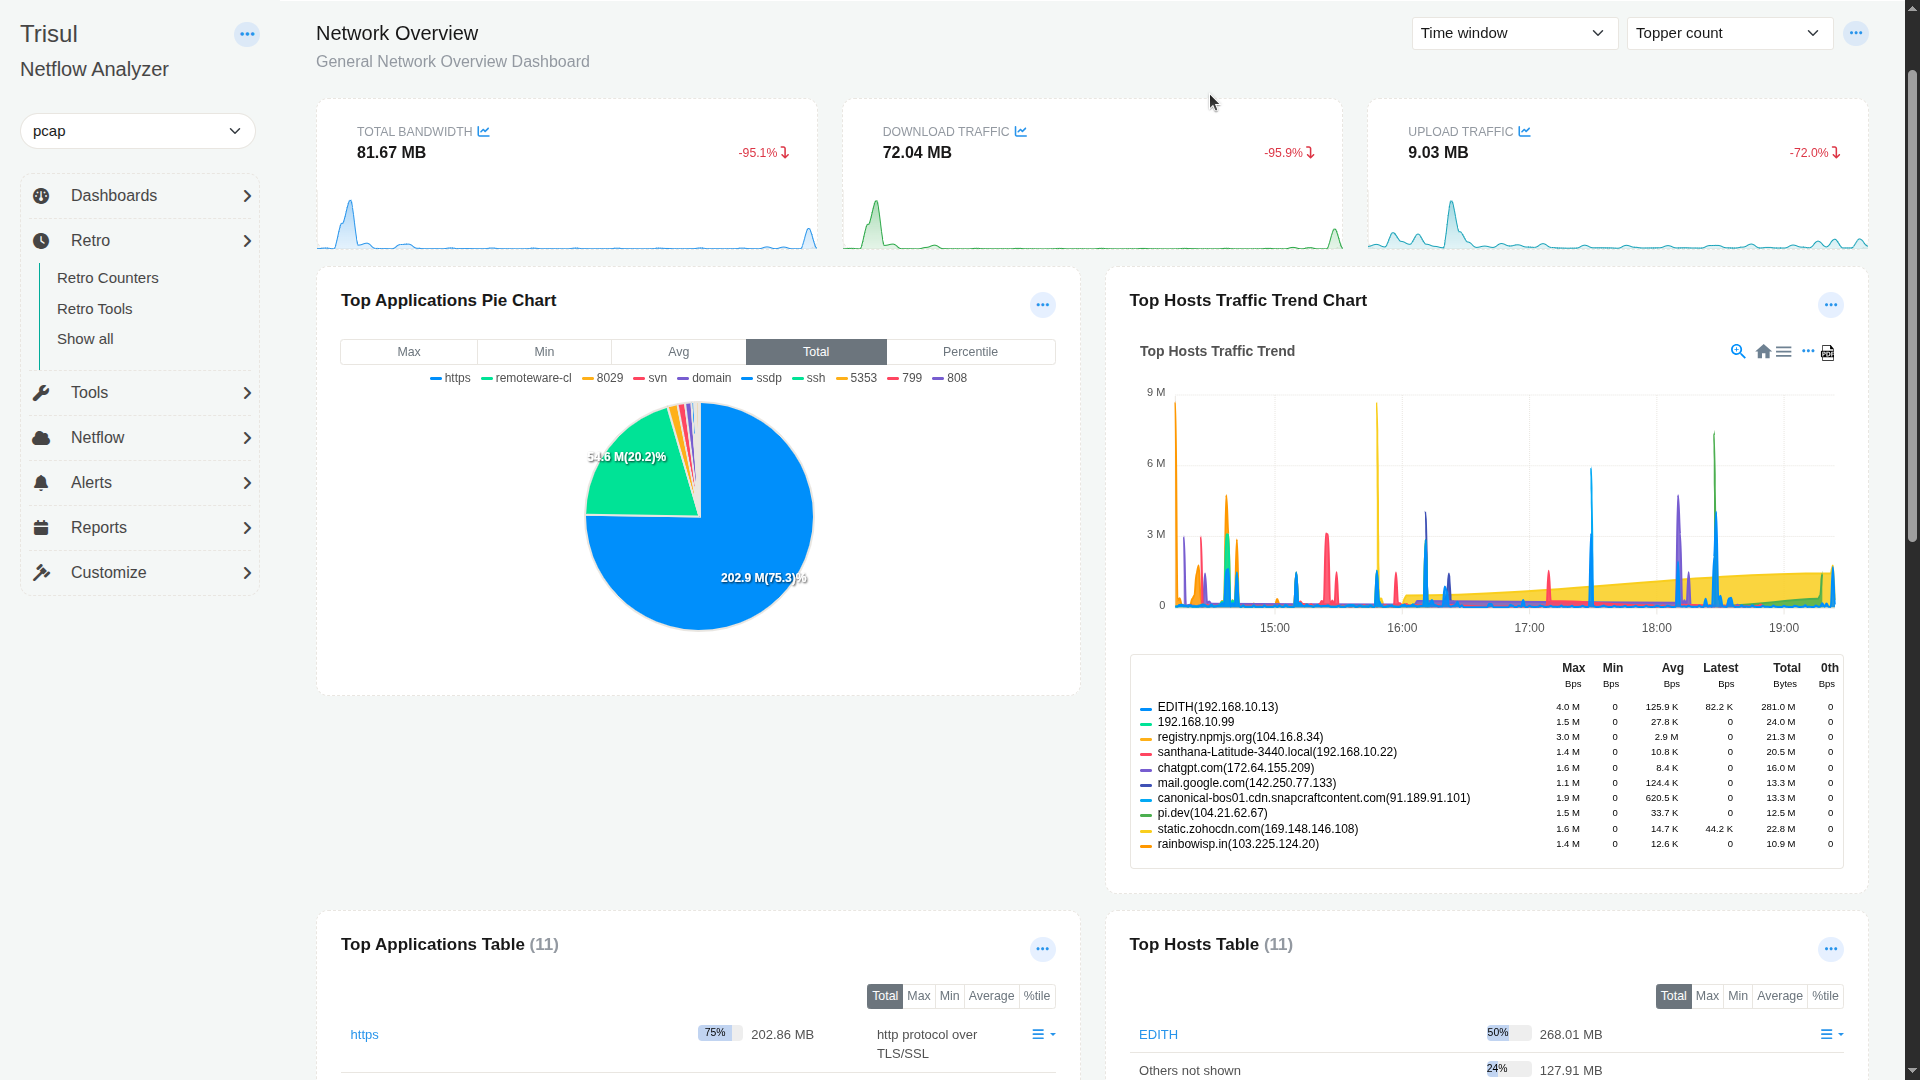
Click View dashboard and there it is. A fully live Network Overview page with real traffic numbers, a working pie chart, a traffic trend line with actual peaks and dips, ranked tables, and a genuinely useful Sankey diagram showing which hosts are hitting which applications. Nobody hand built a single one of these panels.
Where It Gets Genuinely Impressive
Here’s where the earlier version of this post was still being a little theoretical. This part isn’t.
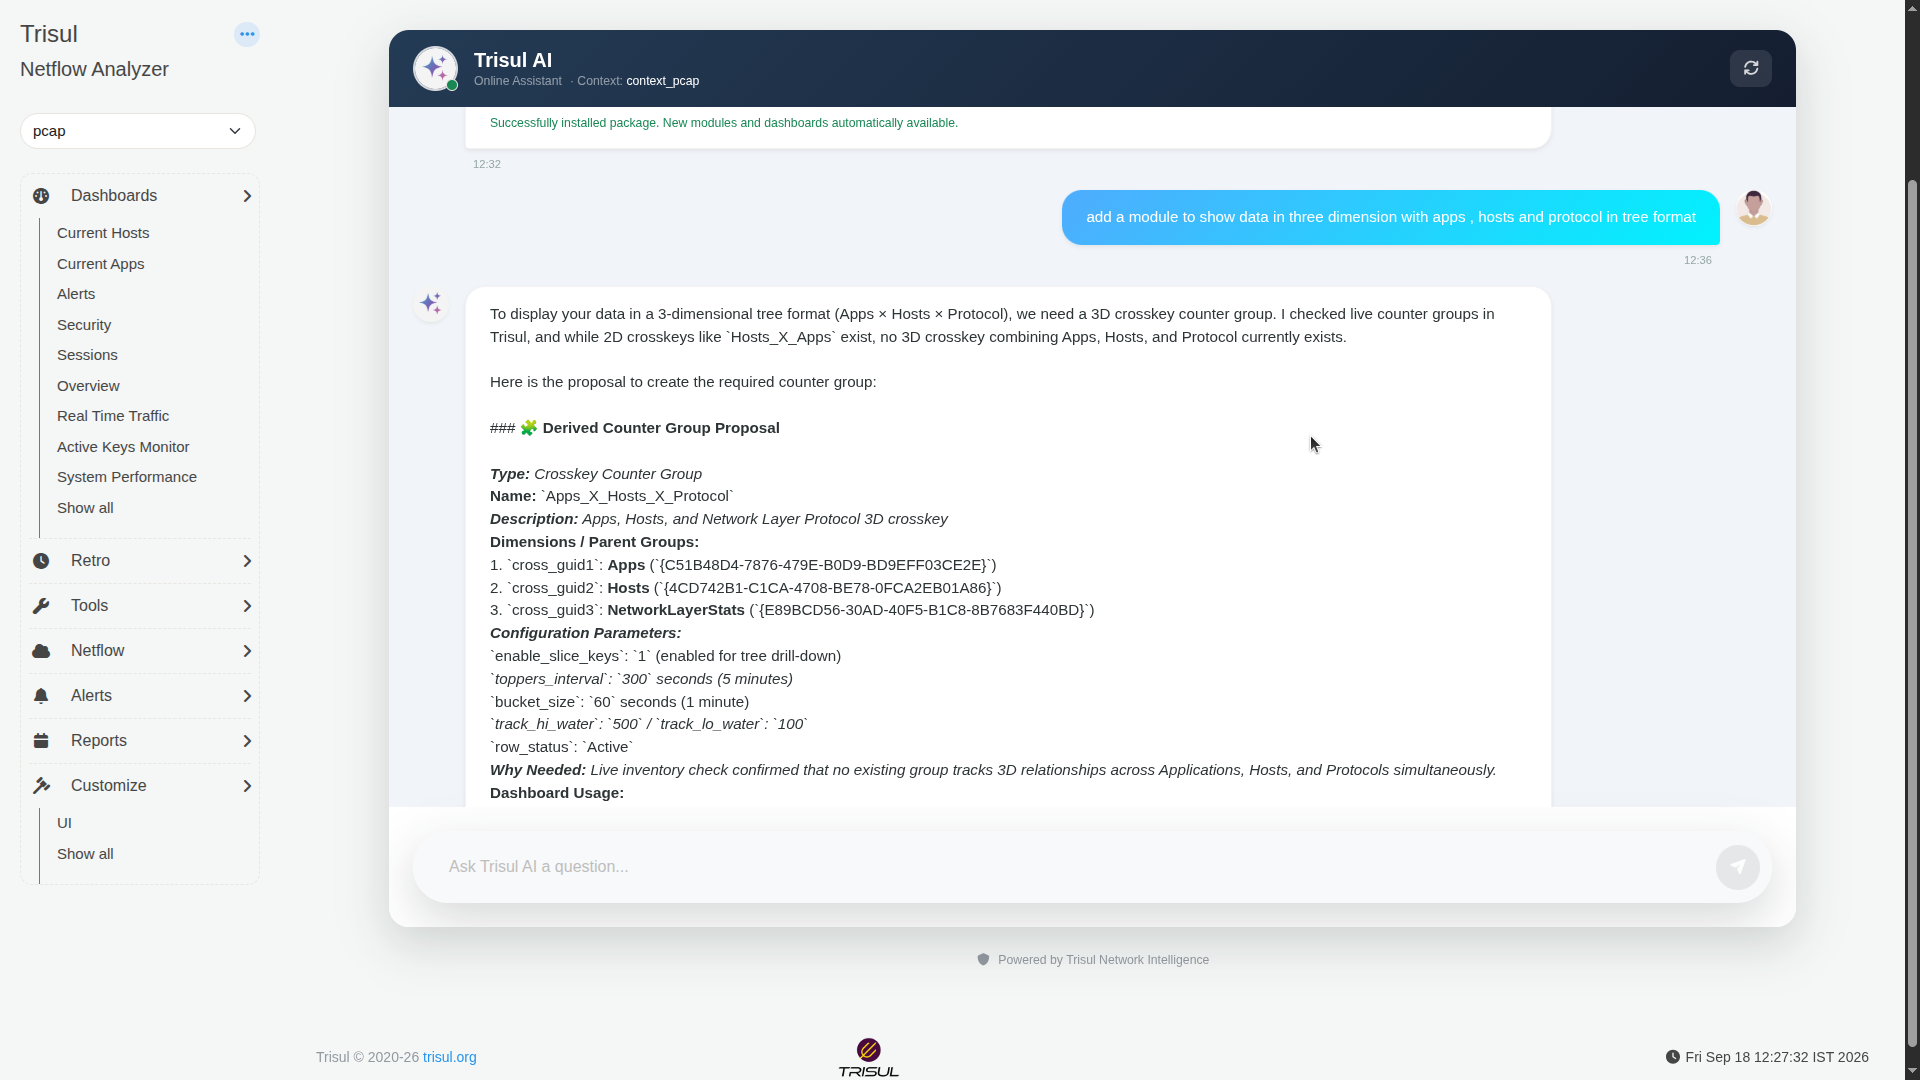
Someone went back into the same chat and asked for more: “add a module to show data in three dimension with apps, hosts and protocol in tree format.” In the old world, this sentence alone would have sent you down a rabbit hole of crosskey creation, dimension mapping, and module wiring.
Trisul AI’s response is honestly the best part of this whole example. It didn’t just guess and build. It checked. It said, and we’re quoting directly here, “I checked live counter groups in Trisul, and while 2D crosskeys like Hosts_X_Apps exist, no 3D crosskey combining Apps, Hosts, and Protocol currently exists.”
So it proposed one. A full derived counter group named Apps_X_Hosts_X_Protocol, with the exact dimensions it would pull from, GUIDs and all, configuration parameters like toppers interval and bucket size, and even a note on why it was needed.
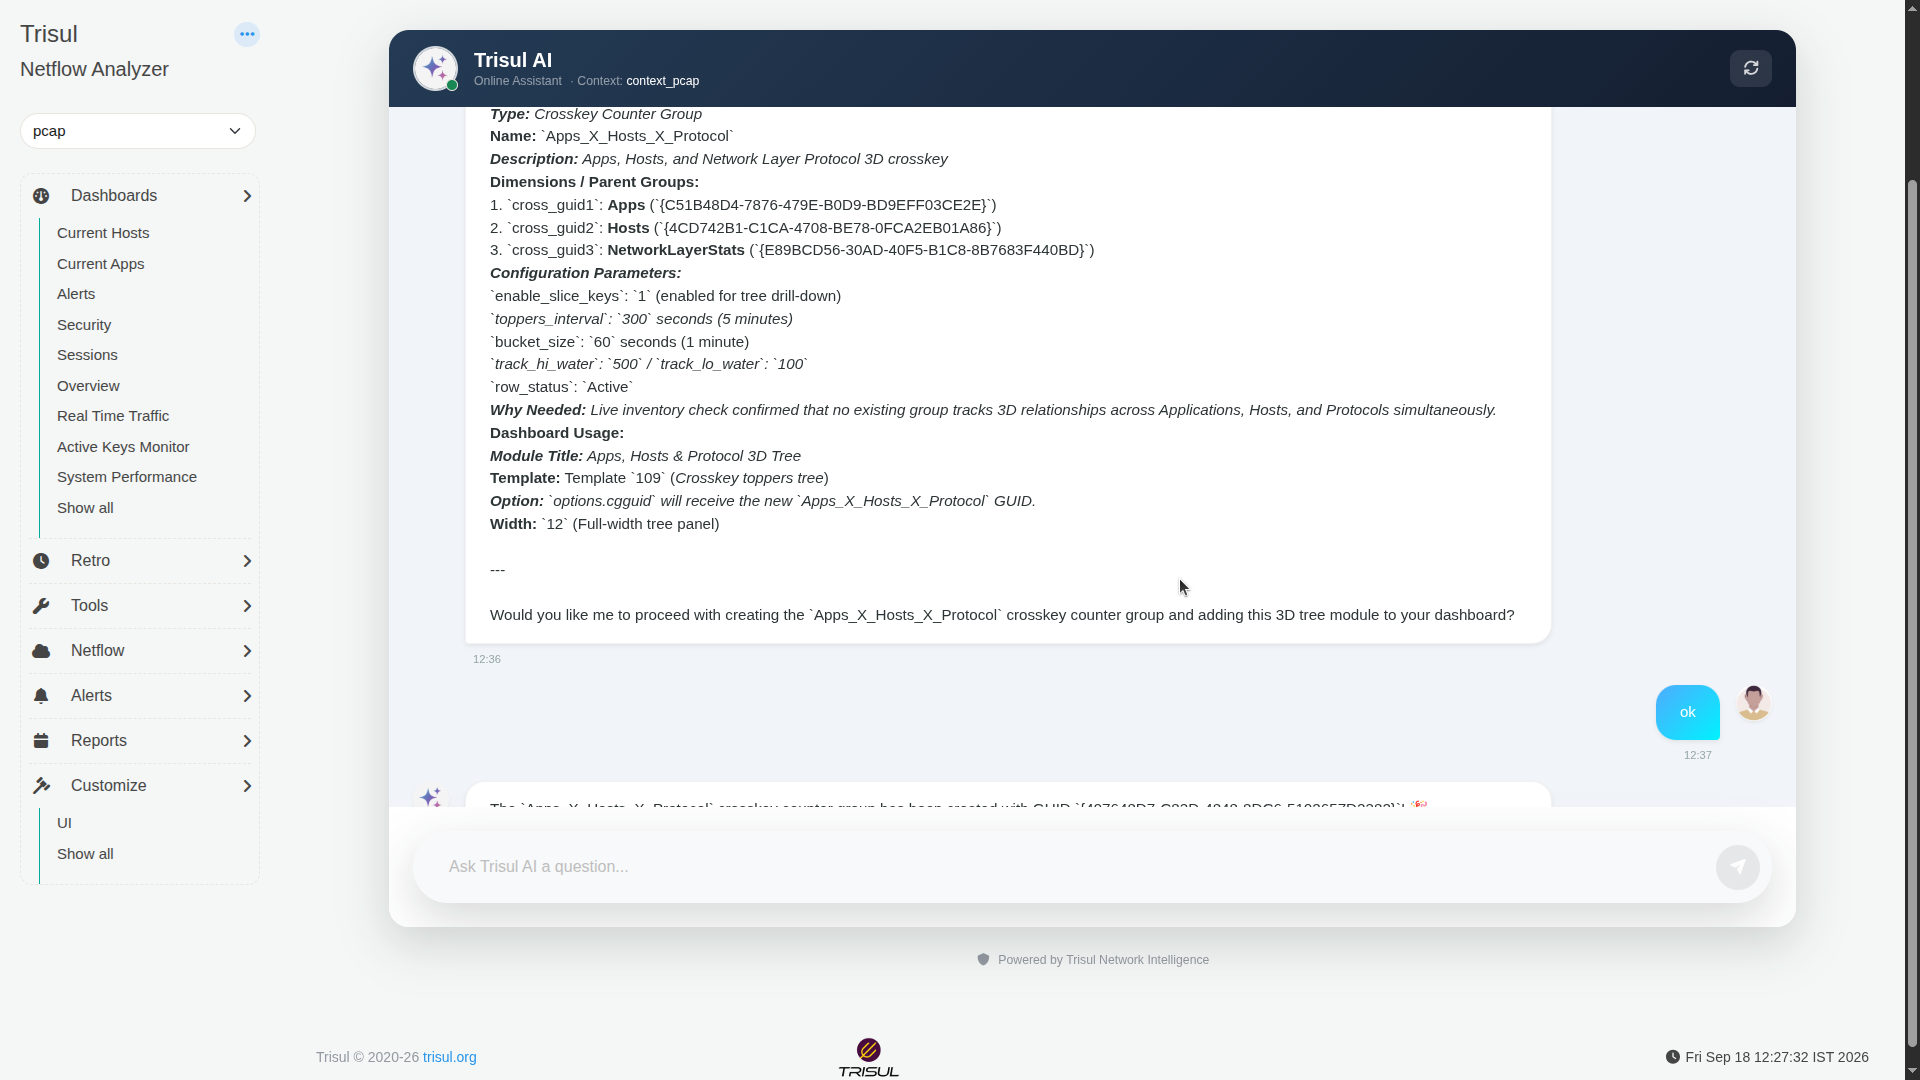
And then, once again, it stopped and asked. “Would you like me to proceed with creating the Apps_X_Hosts_X_Protocol crosskey counter group and adding this 3D tree module to your dashboard?”
From Approval to a Live 3D Tree
Someone said “ok” again.
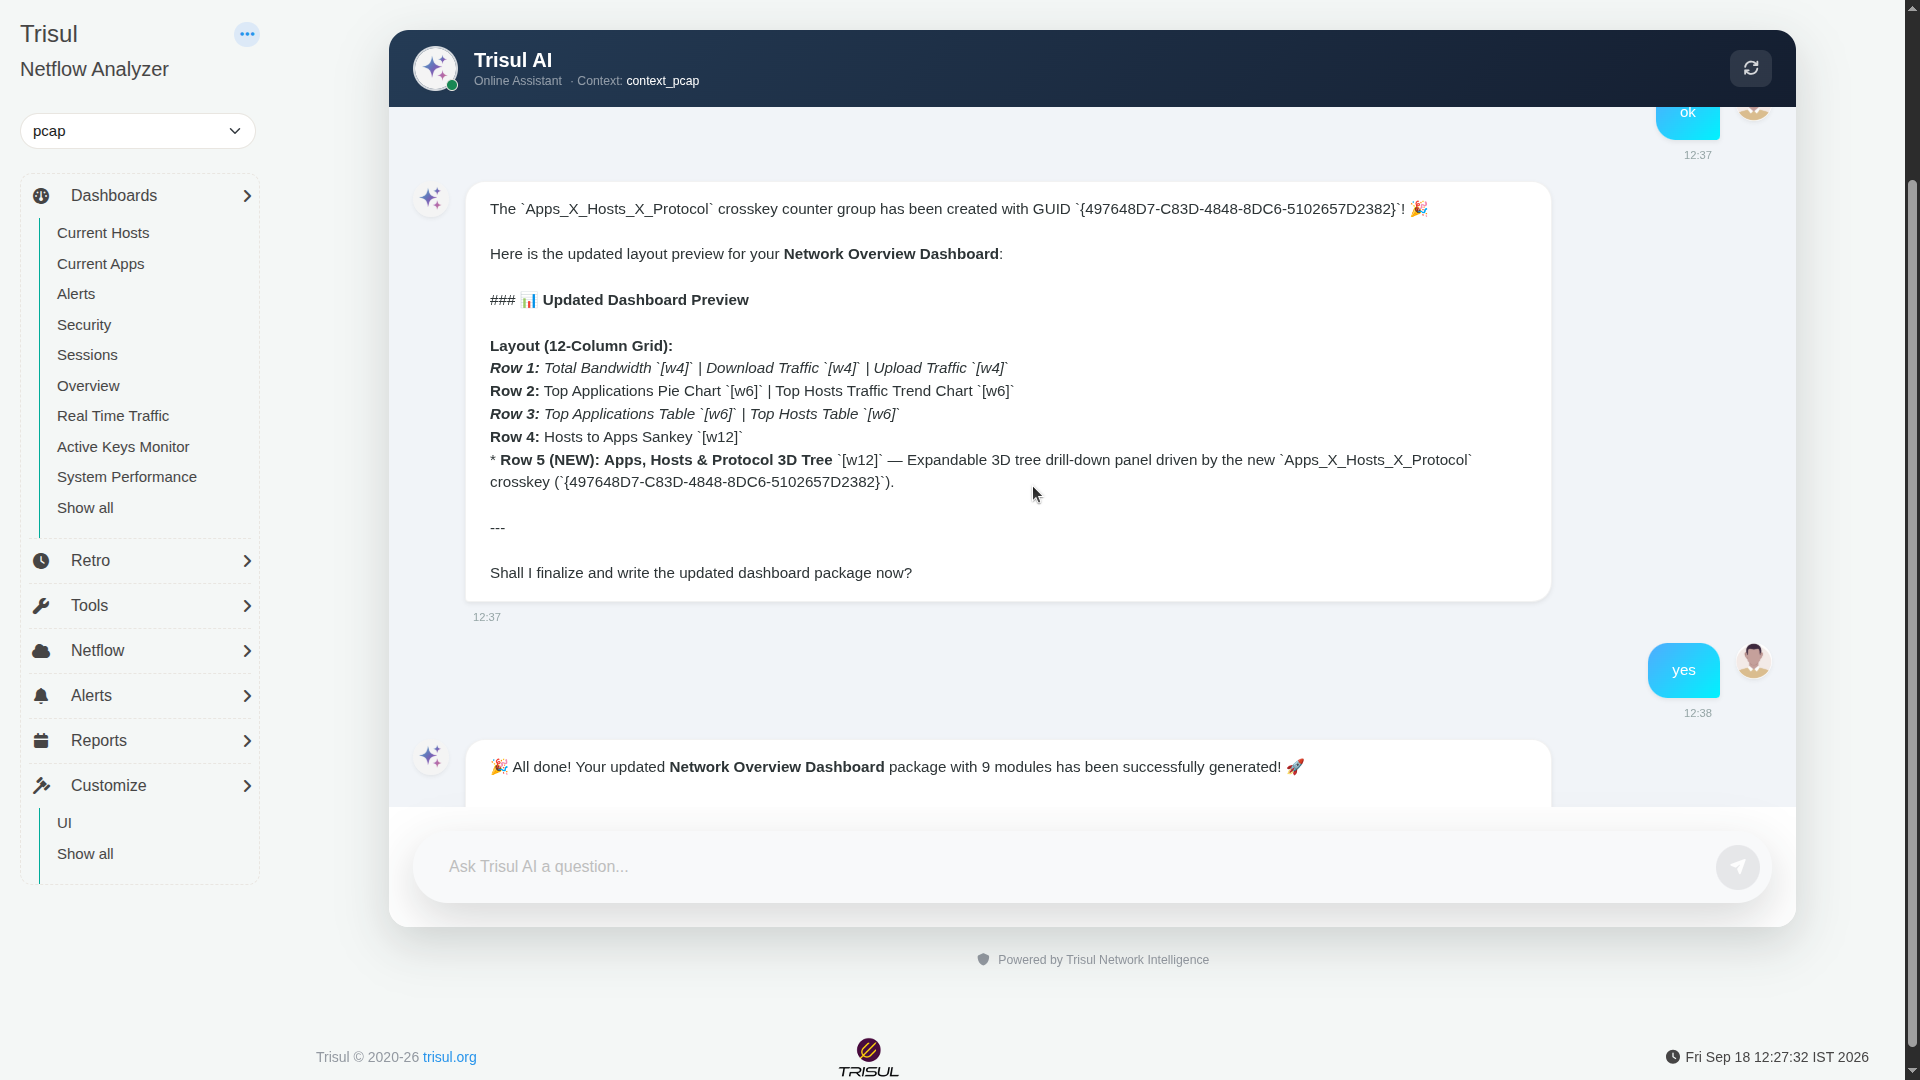
Trisul AI confirmed the new crosskey counter group had been created, GUID and all, and showed an updated layout preview with the new module slotted in as Row 5, a full width Apps, Hosts, and Protocol 3D Tree panel. Then it asked one more time, “Shall I finalize and write the updated dashboard package now?”
One “yes” later:
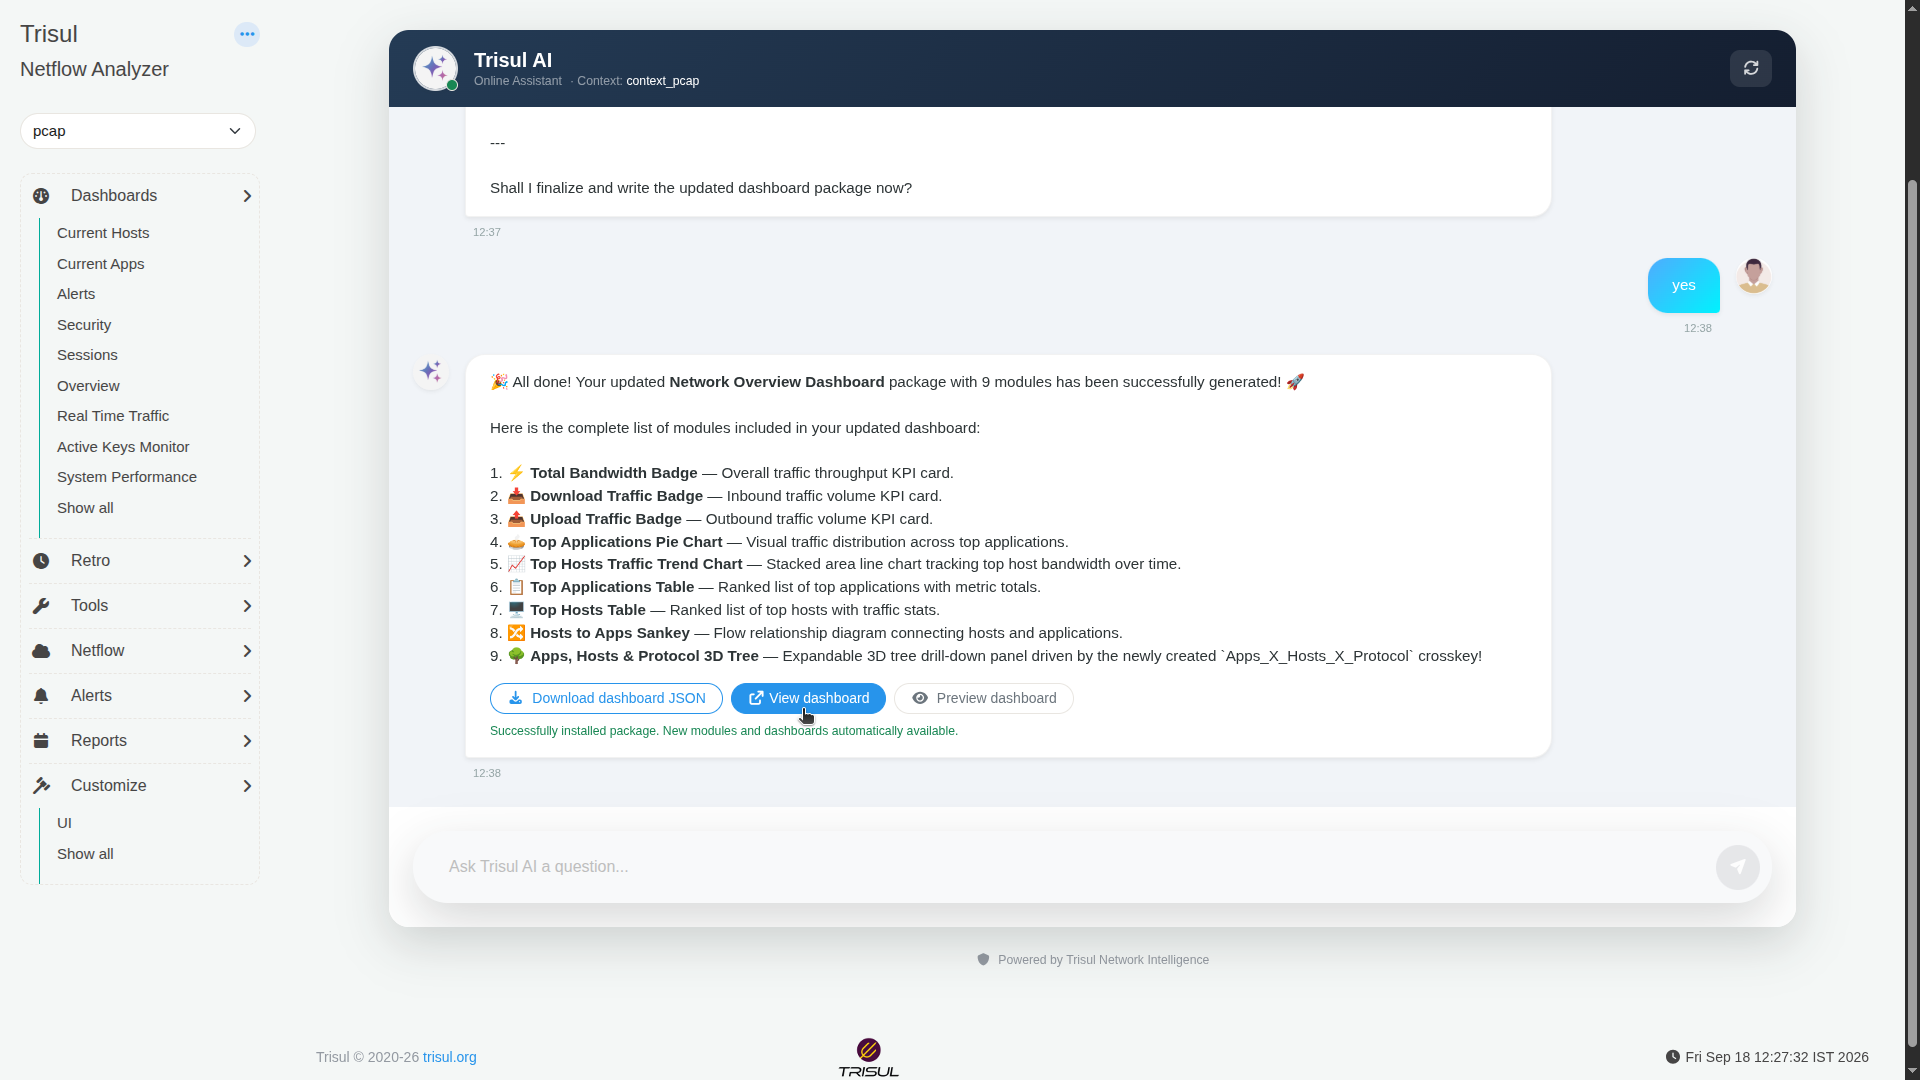
Nine modules, fully generated, fully installed, ready to view.
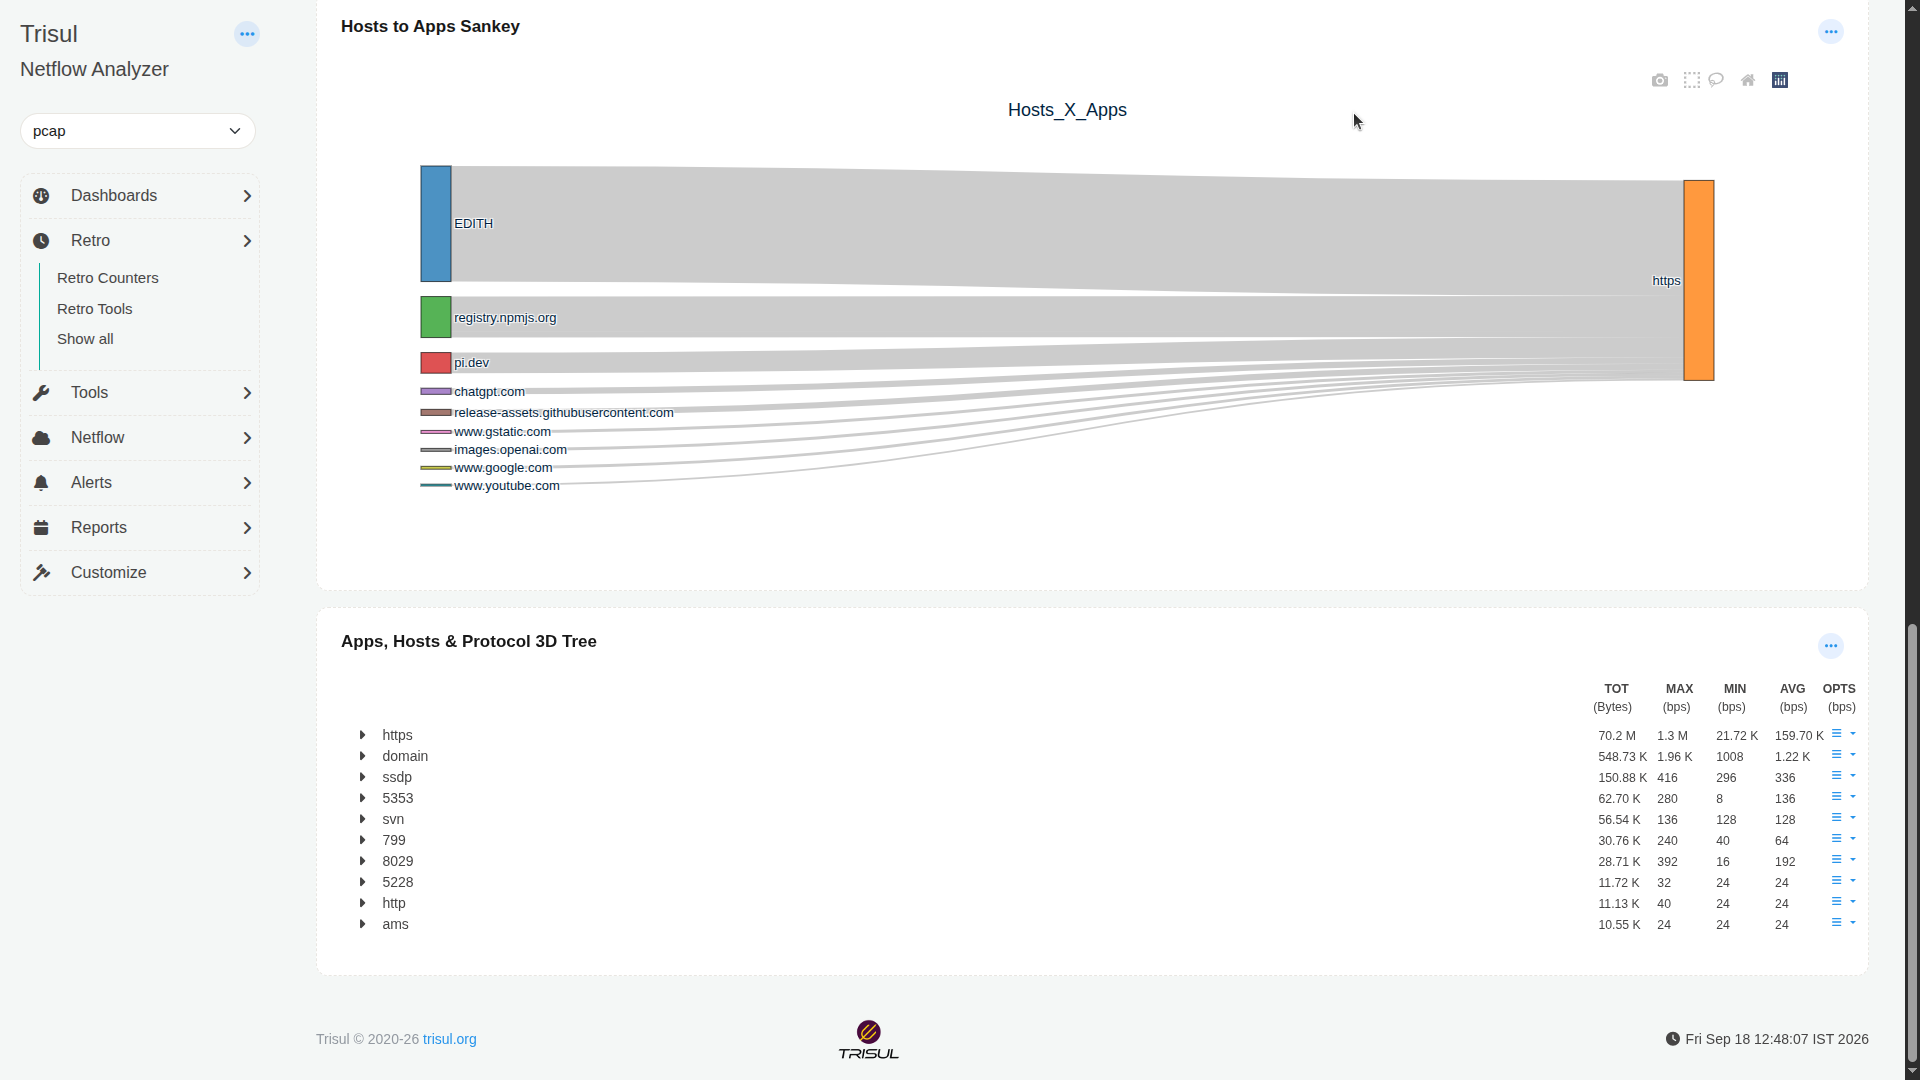
And the payoff is right there on the actual dashboard. An expandable Apps, Hosts, and Protocol 3D Tree, drilling down through https, domain, ssdp, and every other protocol in the capture, sitting right underneath a live Hosts to Apps Sankey. All of that came from two plain English sentences and two clicks of approval.
Why This Actually Matters
What this walkthrough proves is that Trisul AI didn’t just get faster at doing the easy stuff. It’s starting to handle the more involved analysis too, the kind that used to mean understanding crosskey architecture before you could even start. And at no point did it cut corners. It checked what already existed, proposed exactly what it planned to build, and waited for a confirmation before touching anything.
That’s the real evolution here. Not just AI that’s clever, but AI that shows its work, asks before it acts, and still gets you from a sentence to a working nine module dashboard in under ten minutes.
And honestly, this is still early days. This isn’t Trisul AI’s ceiling, it’s a glimpse of where it’s headed.